Daily and Historical Weather
Resource Links
- Daily Weather Data
- 2025 Daily Weather Data
- Weather Data Summary Graphs
- Corn Growing Degree Days
- Drought Map
- Weather Data Download Instructions
- Climatology
- Weather Annual Data Report - 2024
- Weather Related links
Weather Data
*Please note that effective March 1, 2025, the ASC Farmington will no longer be uploading daily weather data to this webpage. If you are looking for weather data related to the Farmington area, please visit the ZiaMet Weather Station Network page and click Farmington ASC.
NMSU Agricultural Science Center at Farmington, New Mexico has collected weather data since 1969. The weather station was designated an official National Weather Station climatological observation site in 1978. Weather observations are collected daily at 8:00 a.m. and electronically reported to the National Oceanic & Atmospheric Administration (NOAA). The data reported to NOAA are over a 24 hour period from 8:00 a.m. previous day to 8:00 a.m. present day.
The air temperature readings are derived from thermometers mounted at the weather station. Soil temperature readings are derived from a maximum/minimum thermometer via sensor probe buried 4 inches deep into bare ground. Precipitation data are collected in a standard eight-inch rain gauge. Evaporation measurements are collected from a Class-A metal pan. Wind movement is recorded in miles per day. The data are collected from two separate three-cup anemometers, at different heights. The high wind movement is collected from 2 meters above the soil surface while the low wind movement is collected from an anemometer position 18 inches above the base of the evaporation pan.
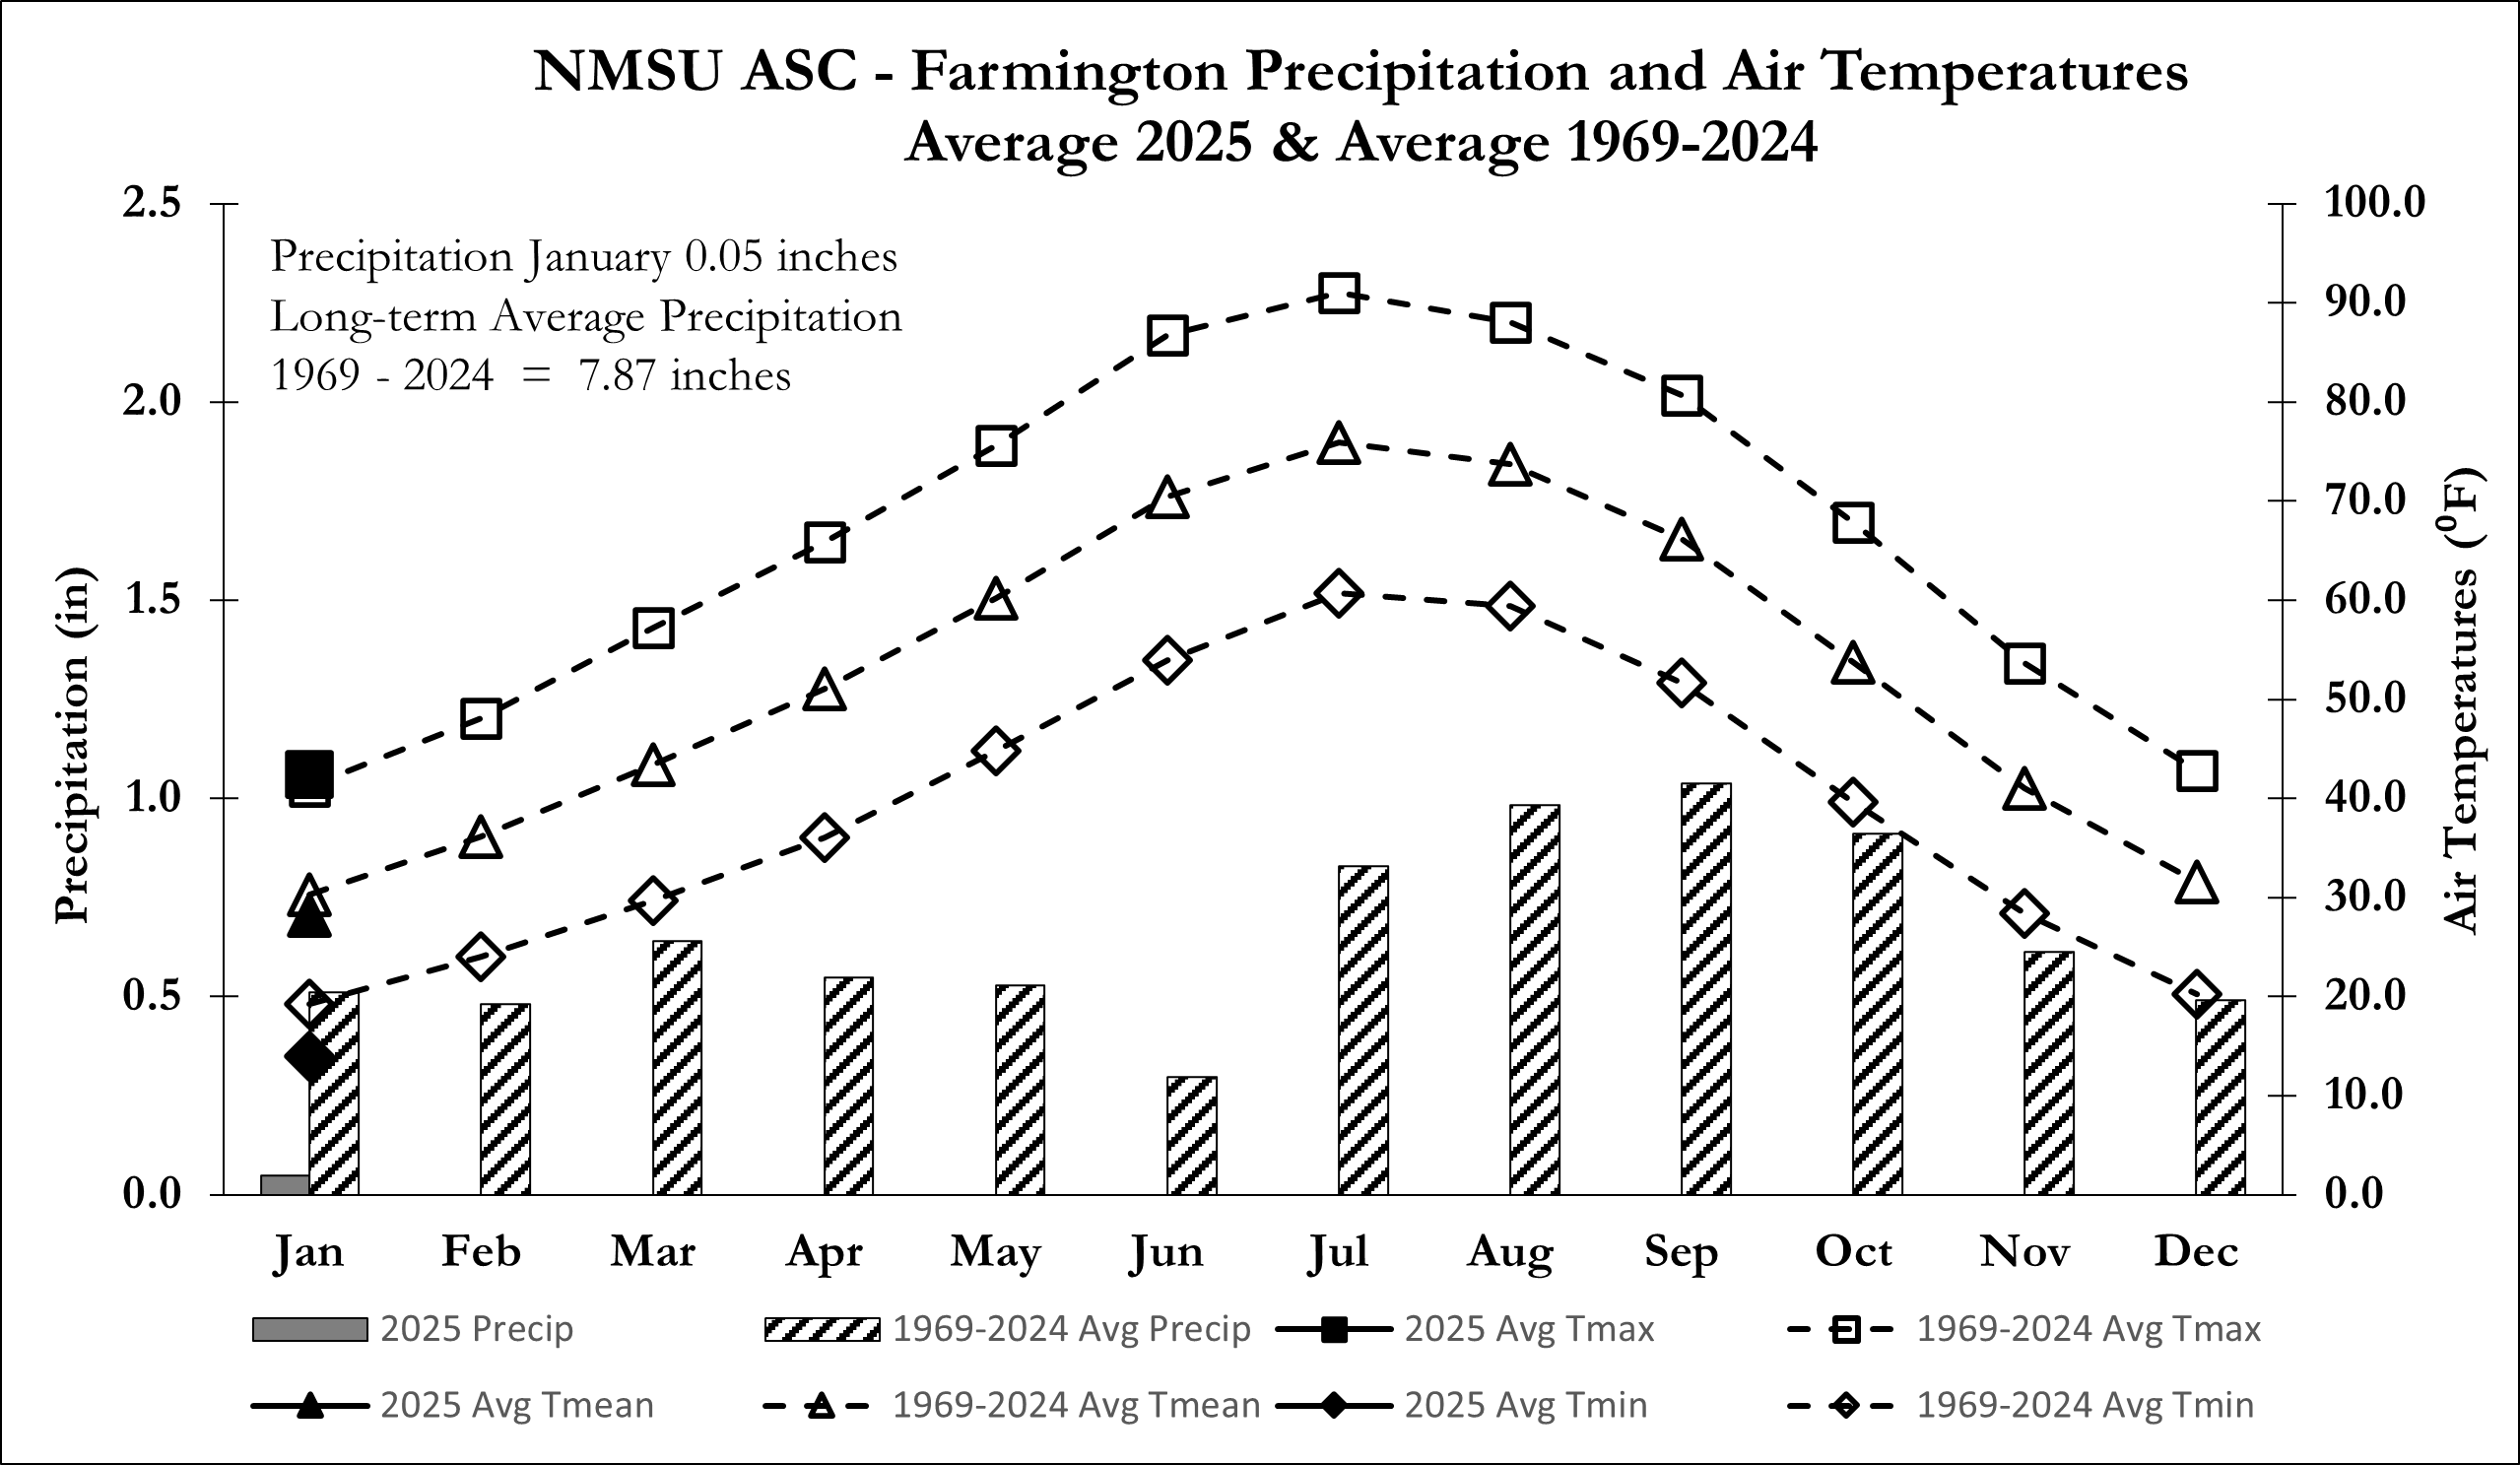
2024 total precipitation recorded at NMSU's ASC Farmington official National Weather Observation site January - December 2024 was 8.71 inches. Mean precipitation from 1969 - 2024 was 7.87 inches.
Weather data recorded at NMSU's Agricultural Science Center - Farmington is displayed in html format. Requests for the current monthly weather data report or yearly archived reports in PDF format may be requested via email from NMSU ASC Farmington.
2025 Historical Weather Data
NMSU ASC Farmington Daily Weather Data February 2025
| Day | Date |
Air Temp
|
Wind Speed
|
Precipitation
|
Evaporation
|
Soil Temp
|
Water Temp
|
||||
|---|---|---|---|---|---|---|---|---|---|---|---|
| Max | Min | 2.0m | 0.25m | Inches | Inches | Max | Min | Max | Min | ||
| Sat | 01 | 53 | 23 | 41 | 32 | 0.00 | N/A | 40 | 31 | N/A | N/A |
| Sun | 02 | 56 | 30 | 34 | 31 | 0.00 | N/A | 44 | 34 | N/A | N/A |
| Mon | 03 | 65 | 34 | 35 | 29 | 0.00 | N/A | 38 | 34 | N/A | N/A |
| Tue | 04 | 71 | 38 | 35 | 29 | 0.00 | N/A | 38 | 34 | N/A | N/A |
| Wed | 05 | 70 | 31 | 41 | 37 | 0.00 | N/A | 52 | 40 | N/A | N/A |
| Thu | 06 | 65 | 29 | 57 | 51 | 0.00 | N/A | 52 | 38 | N/A | N/A |
| Fri | 07 | 66 | 29 | 43 | 36 | 0.00 | N/A | 52 | 38 | N/A | N/A |
| Sat | 08 | 64 | 30 | 41 | 39 | 0.00 | N/A | 51 | 38 | N/A | N/A |
| Sun | 09 | 58 | 22 | 36 | 33 | 0.00 | N/A | 53 | 39 | N/A | N/A |
| Mon | 10 | 48 | 27 | 32 | 32 | 0.00 | N/A | 48 | 37 | N/A | N/A |
| Tue | 11 | 55 | 27 | 39 | 33 | 0.00 | N/A | 49 | 29 | N/A | N/A |
| Wed | 12 | 50 | 09 | 94 | 74 | 0.00 | N/A | 44 | 35 | N/A | N/A |
| Thu | 13 | 38 | 09 | 89 | 70 | 0.00 | N/A | 44 | 32 | N/A | N/A |
| Fri | 14 | 49 | 21 | 83 | 62 | 0.07 | N/A | 42 | 31 | N/A | N/A |
| Sat | 15 | 49 | 31 | 59 | 49 | 0.15 | N/A | 44 | 37 | N/A | N/A |
| Sun | 16 | 45 | 20 | 102 | 70 | 0.00 | N/A | 43 | 33 | N/A | N/A |
| Mon | 17 | 48 | 28 | 49 | 37 | 0.00 | N/A | 45 | 32 | N/A | N/A |
| Tue | 18 | 56 | 32 | 46 | 42 | 0.00 | N/A | 50 | 34 | N/A | N/A |
| Wed | 19 | 50 | 20 | 85 | 72 | 0.00 | N/A | 51 | 36 | N/A | N/A |
| Thu | 20 | 51 | 28 | 47 | 38 | 0.00 | N/A | 54 | 29 | N/A | N/A |
| Fri | 21 | 55 | 24 | 77 | 61 | 0.00 | N/A | 52 | 36 | N/A | N/A |
| Sat | 22 | 50 | 18 | 62 | 51 | 0.00 | N/A | 51 | 35 | N/A | N/A |
| Sun | 23 | 53 | 24 | 68 | 59 | 0.00 | N/A | 51 | 36 | N/A | N/A |
| Mon | 24 | 59 | 27 | 86 | 69 | 0.00 | N/A | 52 | 36 | N/A | N/A |
| Tue | 25 | 64 | 30 | 87 | 69 | 0.00 | N/A | 55 | 37 | N/A | N/A |
| Wed | 26 | 66 | 30 | 53 | 47 | 0.00 | N/A | 56 | 40 | N/A | N/A |
| Thu | 27 | 54 | 21 | 147 | 110 | 0.00 | N/A | 53 | 37 | N/A | N/A |
| Fri | 28 | 59 | 21 | 31 | 29 | 0.00 | N/A | 55 | 36 | N/A | N/A |
| February Precip. Total/Evap. Average |
0.22 | ||||||||||
| Maximum (2.0 meter) and Minimum (0.25 meter) wind speed is recorded in miles per day. The data is reported to the National Weather Service over a 24 hour period from 8:00 a.m. previous day to 8:00 a.m. present day. |
|||||||||||
NMSU ASC Farmington Daily Weather Data January 2025
| Day | Date |
Air Temp
|
Wind Speed
|
Precipitation
|
Evaporation
|
Soil Temp
|
Water Temp
|
||||
|---|---|---|---|---|---|---|---|---|---|---|---|
| Max | Min | 2.0m | 0.25m | Inches | Inches | Max | Min | Max | Min | ||
| Wed | 01 | 43 | 14 | 42 | 35 | 0.00 | N/A | 40 | 32 | N/A | N/A |
| Thu | 02 | 45 | 23 | 37 | 26 | 0.00 | N/A | 35 | 29 | N/A | N/A |
| Fri | 03 | 51 | 25 | 50 | 35 | 0.00 | N/A | 40 | 32 | N/A | N/A |
| Sat | 04 | 56 | 32 | 53 | 39 | 0.00 | N/A | 40 | 32 | N/A | N/A |
| Sun | 05 | 54 | 20 | 151 | 114 | 0.00 | N/A | 44 | 34 | N/A | N/A |
| Mon | 06 | 42 | 15 | 95 | 68 | 0.00 | N/A | 38 | 33 | N/A | N/A |
| Tue | 07 | 44 | 19 | 17 | 14 | 0.00 | N/A | 36 | 32 | N/A | N/A |
| Wed | 08 | 47 | 15 | 87 | 58 | 0.00 | N/A | 40 | 32 | N/A | N/A |
| Thu | 09 | 40 | 16 | 22 | 24 | 0.00 | N/A | 38 | 32 | N/A | N/A |
| Fri | 10 | 40 | 09 | 27 | 27 | 0.00 | N/A | 35 | 31 | N/A | N/A |
| Sat | 11 | 39 | 13 | 75 | 53 | 0.00 | N/A | 34 | 31 | N/A | N/A |
| Sun | 12 | 41 | 07 | 100 | 64 | 0.00 | N/A | 34 | 29 | N/A | N/A |
| Mon | 13 | 40 | 17 | 36 | 21 | 0.00 | N/A | 30 | 28 | N/A | N/A |
| Tue | 14 | 40 | 04 | 30 | 20 | 0.00 | N/A | 31 | 29 | N/A | N/A |
| Wed | 15 | 36 | 05 | 51 | 37 | 0.00 | N/A | 30 | 27 | N/A | N/A |
| Thur | 16 | 38 | 12 | 12 | 13 | 0.00 | N/A | 30 | 25 | N/A | N/A |
| Fri | 17 | 45 | 13 | 19 | 22 | 0.00 | N/A | 31 | 26 | N/A | N/A |
| Sat | 18 | 45 | 19 | 66 | 51 | 0.00 | N/A | 31 | 28 | N/A | N/A |
| Sun | 19 | 35 | 07 | 141 | 98 | 0.00 | N/A | 30 | 26 | N/A | N/A |
| Mon | 20 | 29 | 06 | 32 | 20 | 0.00 | N/A | 28 | 24 | N/A | N/A |
| Tue | 21 | 29 | -4 | 173 | 124 | 0.00 | N/A | 29 | 21 | N/A | N/A |
| Wed | 22 | 29 | -1 | 30 | 24 | 0.00 | N/A | 28 | 19 | N/A | N/A |
| Thu | 23 | 38 | 0 | 119 | 90 | 0.00 | N/A | 28 | 20 | N/A | N/A |
| Fri | 24 | 33 | 07 | 58 | 48 | 0.00 | N/A | 27 | 21 | N/A | N/A |
| Sat | 25 | 43 | 14 | 69 | 42 | 0.00 | N/A | 29 | 22 | N/A | N/A |
| Sun | 26 | 50 | 25 | 57 | 45 | 0.00 | N/A | 30 | 22 | N/A | N/A |
| Mon | 27 | 53 | 23 | 58 | 39 | 0.00 | N/A | 34 | 29 | N/A | N/A |
| Tue | 28 | 54 | 20 | 46 | 38 | 0.00 | N/A | 36 | 30 | N/A | N/A |
| Wed | 29 | 54 | 23 | 81 | 57 | 0.00 | N/A | 37 | 31 | N/A | N/A |
| Thu | 30 | 35 | 23 | 17 | 20 | 0.05 | N/A | 33 | 32 | N/A | N/A |
| Fri | 31 | 44 | 14 | 148 | 111 | 0.00 | N/A | 38 | 32 | N/A | N/A |
| January Precip. Total/Evap. Average |
0.05 | ||||||||||
| Maximum (2.0 meter) and Minimum (0.25 meter) wind speed is recorded in miles per day. The data is reported to the National Weather Service over a 24 hour period from 8:00 a.m. previous day to 8:00 a.m. present day. |
|||||||||||
NMSU ASC Farmington Daily Weather Data December 2024
| Day | Date |
Air Temp
|
Wind Speed
|
Precipitation
|
Evaporation
|
Soil Temp
|
Water Temp
|
||||
|---|---|---|---|---|---|---|---|---|---|---|---|
| Max | Min | 2.0m | 0.25m | Inches | Inches | Max | Min | Max | Min | ||
| Sun | 01 | 41 | 16 | 19 | 20 | 0.00 | N/A | 37 | 32 | N/A | N/A |
| Mon | 02 | 44 | 18 | 20 | 21 | 0.00 | N/A | 36 | 32 | N/A | N/A |
| Tue | 03 | 47 | 22 | 21 | 23 | 0.00 | N/A | 39 | 32 | N/A | N/A |
| Wed | 04 | 58 | 20 | 22 | 21 | 0.00 | N/A | 42 | 34 | N/A | N/A |
| Thu | 05 | 50 | 22 | 19 | 24 | 0.00 | N/A | 42 | 33 | N/A | N/A |
| Fri | 06 | 55 | 22 | 25 | 18 | 0.00 | N/A | 44 | 33 | N/A | N/A |
| Sat | 07 | 50 | 21 | 21 | 20 | 0.00 | N/A | 43 | 33 | N/A | N/A |
| Sun | 08 | 46 | 16 | 28 | 25 | 0.00 | N/A | 41 | 34 | N/A | N/A |
| Mon | 09 | 48 | 20 | 26 | 28 | 0.00 | N/A | 40 | 33 | N/A | N/A |
| Tue | 10 | 42 | 17 | 143 | 106 | 0.00 | N/A | 39 | 33 | N/A | N/A |
| Wed | 11 | 36 | 13 | 115 | 90 | 0.00 | N/A | 32 | 31 | N/A | N/A |
| Thu | 12 | 40 | 19 | 35 | 32 | 0.00 | N/A | 31 | 30 | N/A | N/A |
| Fri | 13 | 48 | 24 | 46 | 38 | 0.00 | N/A | 32 | 29 | N/A | N/A |
| Sat | 14 | 46 | 18 | 41 | 37 | 0.00 | N/A | 36 | 32 | N/A | N/A |
| Sun | 15 | 48 | 26 | 33 | 28 | 0.00 | N/A | 40 | 38 | N/A | N/A |
| Mon | 16 | 51 | 19 | 30 | 27 | 0.00 | N/A | 42 | 33 | N/A | N/A |
| Tue | 17 | 52 | 25 | 40 | 26 | 0.00 | N/A | 46 | 32 | N/A | N/A |
| Wed | 18 | 52 | 20 | 42 | 35 | 0.00 | N/A | 40 | 33 | N/A | N/A |
| Thu | 19 | 51 | 19 | 18 | 17 | 0.00 | N/A | 39 | 32 | N/A | N/A |
| Fri | 20 | 49 | 21 | 25 | 21 | 0.00 | N/A | 38 | 31 | N/A | N/A |
| Sat | 21 | 55 | 17 | 16 | 15 | 0.00 | N/A | 40 | 32 | N/A | N/A |
| Sun | 22 | 52 | 22 | 16 | 20 | 0.00 | N/A | 40 | 33 | N/A | N/A |
| Mon | 23 | 54 | 31 | 21 | 17 | 0.00 | N/A | 40 | 32 | N/A | N/A |
| Tue | 24 | 53 | 20 | 52 | 42 | 0.00 | N/A | 39 | 35 | N/A | N/A |
| Wed | 25 | 51 | 25 | 68 | 50 | 0.00 | N/A | 43 | 34 | N/A | N/A |
| Thu | 26 | 45 | 21 | 35 | 32 | 0.03 | N/A | 42 | 34 | N/A | N/A |
| Fri | 27 | 38 | 24 | 11 | 12 | 0.00 | N/A | 42 | 33 | N/A | N/A |
| Sat | 28 | 51 | 26 | 24 | 24 | 0.00 | N/A | 42 | 34 | N/A | N/A |
| Sun | 29 | 49 | 29 | 47 | 34 | 0.00 | N/A | 42 | 31 | N/A | N/A |
| Mon | 30 | 62 | 26 | 18 | 21 | 0.00 | N/A | 45 | 33 | N/A | N/A |
| Tue | 31 | 50 | 17 | 74 | 55 | 0.00 | N/A | 42 | 34 | N/A | N/A |
| December Precip. Total/Evap. Average |
0.03 | ||||||||||
| Maximum (2.0 meter) and Minimum (0.25 meter) wind speed is recorded in miles per day. The data is reported to the National Weather Service over a 24 hour period from 8:00 a.m. previous day to 8:00 a.m. present day. |
|||||||||||
NMSU ASC Farmington Daily Weather Data November 2024
| Day | Date |
Air Temp
|
Wind Speed
|
Precipitation
|
Evaporation
|
Soil Temp
|
Water Temp
|
||||
|---|---|---|---|---|---|---|---|---|---|---|---|
| Max | Min | 2.0m | 0.25m | Inches | Inches | Max | Min | Max | Min | ||
| Fri | 01 | 59 | 30 | 45 | 36 | 0.00 | N/A | 56 | 41 | N/A | N/A |
| Sat | 02 | 66 | 34 | 35 | 33 | 0.00 | N/A | 56 | 43 | N/A | N/A |
| Sun | 03 | 65 | 40 | 65 | 53 | 0.00 | N/A | 58 | 44 | N/A | N/A |
| Mon | 04 | 50 | 32 | 69 | 42 | 0.08 | N/A | 52 | 43 | N/A | N/A |
| Tue | 05 | 49 | 25 | 121 | 80 | 0.00 | N/A | 50 | 38 | N/A | N/A |
| Wed | 06 | 51 | 27 | 64 | 54 | 0.03 | N/A | 50 | 36 | N/A | N/A |
| Thu | 07 | 38 | 22 | 46 | 32 | 0.10 | N/A | 42 | 36 | N/A | N/A |
| Fri | 08 | 35 | 28 | 10 | 11 | 0.20 | N/A | 37 | 36 | N/A | N/A |
| Sat | 09 | 39 | 27 | 19 | 07 | 0.00 | N/A | 42 | 36 | N/A | N/A |
| Sun | 10 | 49 | 31 | 45 | 31 | 0.00 | N/A | 46 | 36 | N/A | N/A |
| Mon | 11 | 56 | 32 | 14 | 14 | 0.00 | N/A | 49 | 36 | N/A | N/A |
| Tue | 12 | 63 | 37 | 62 | 37 | 0.00 | N/A | 52 | 37 | N/A | N/A |
| Wed | 13 | 54 | 25 | 103 | 78 | 0.00 | N/A | 50 | 37 | N/A | N/A |
| Thu | 14 | 52 | 29 | 26 | 21 | 0.00 | N/A | 48 | 37 | N/A | N/A |
| Fri | 15 | 64 | 36 | 51 | 37 | 0.00 | N/A | 50 | 36 | N/A | N/A |
| Sat | 16 | 67 | 27 | 74 | 69 | 0.00 | N/A | 52 | 39 | N/A | N/A |
| Sun | 17 | 50 | 21 | 25 | 26 | 0.00 | N/A | 48 | 36 | N/A | N/A |
| Mon | 18 | 50 | 22 | 40 | 41 | 0.00 | N/A | 47 | 33 | N/A | N/A |
| Tue | 19 | 50 | 26 | 38 | 37 | 0.00 | N/A | 45 | 36 | N/A | N/A |
| Wed | 20 | 41 | 17 | 82 | 65 | 0.00 | N/A | 42 | 29 | N/A | N/A |
| Thu | 21 | 48 | 23 | 42 | 33 | 0.00 | N/A | 25 | 22 | N/A | N/A |
| Fri | 22 | 55 | 22 | 26 | 28 | 0.00 | N/A | 44 | 33 | N/A | N/A |
| Sat | 23 | 57 | 25 | 38 | 31 | 0.00 | N/A | 44 | 34 | N/A | N/A |
| Sun | 24 | 65 | 33 | 33 | 31 | 0.00 | N/A | 47 | 34 | N/A | N/A |
| Mon | 25 | 61 | 25 | 34 | 32 | 0.00 | N/A | 47 | 36 | N/A | N/A |
| Tue | 26 | 53 | 33 | 21 | 24 | 0.00 | N/A | 46 | 37 | N/A | N/A |
| Wed | 27 | 53 | 33 | 76 | 60 | 0.05 | N/A | 45 | 42 | N/A | N/A |
| Thu | 28 | 43 | 16 | 65 | 51 | 0.00 | N/A | 42 | 35 | N/A | N/A |
| Fri | 29 | 42 | 16 | 24 | 15 | 0.00 | N/A | 42 | 34 | N/A | N/A |
| Sat | 30 | 41 | 12 | 10 | 09 | 0.00 | N/A | 38 | 30 | N/A | N/A |
| November Precip. Total/Evap. Average |
0.46 | N/A | |||||||||
| Maximum (2.0 meter) and Minimum (0.25 meter) wind speed is recorded in miles per day. The data is reported to the National Weather Service over a 24 hour period from 8:00 a.m. previous day to 8:00 a.m. present day. |
|||||||||||
NMSU ASC Farmington Daily Weather Data October 2024
| Day | Date |
Air Temp
|
Wind Speed
|
Precipitation
|
Evaporation
|
Soil Temp
|
Water Temp
|
||||
|---|---|---|---|---|---|---|---|---|---|---|---|
| Max | Min | 2.0m | 0.25m | Inches | Inches | Max | Min | Max | Min | ||
| Tue | 01 | 88 | 51 | 55 | 43 | 0.00 | 0.254 | 83 | 69 | 81 | 55 |
| Wed | 02 | 88 | 53 | 31 | 28 | 0.00 | 0.300 | 82 | 68 | 82 | 55 |
| Thu | 03 | 84 | 45 | 36 | 28 | 0.00 | 0.298 | 81 | 66 | 79 | 52 |
| Fri | 04 | 83 | 35 | 36 | 35 | 0.00 | 0.193 | 80 | 65 | 77 | 51 |
| Sat | 05 | 86 | 48 | 42 | 40 | 0.00 | 0.241 | 80 | 65 | 77 | 51 |
| Sun | 06 | 81 | 44 | 42 | 40 | 0.00 | 0.241 | 80 | 63 | 79 | 49 |
| Mon | 07 | 81 | 48 | 27 | 29 | 0.00 | 0.252 | 78 | 63 | 76 | 50 |
| Tue | 08 | 79 | 45 | 32 | 34 | 0.00 | 0.273 | 77 | 63 | 76 | 50 |
| Wed | 09 | 80 | 46 | 39 | 38 | 0.00 | 0.250 | 76 | 63 | 75 | 50 |
| Thu | 10 | 82 | 50 | 39 | 31 | 0.00 | 0.268 | 77 | 64 | 76 | 50 |
| Fri | 11 | 77 | 27 | 34 | 29 | 0.00 | 0.350 | 76 | 63 | 76 | 51 |
| Sat | 12 | 86 | 48 | 35 | 36 | 0.00 | 0.034 | 81 | 62 | 75 | 51 |
| Sun | 13 | 81 | 48 | 21 | 18 | 0.00 | 0.298 | 76 | 64 | 75 | 51 |
| Mon | 14 | 84 | 54 | 24 | 25 | 0.00 | 0.376 | 75 | 63 | 74 | 52 |
| Tue | 15 | 82 | 48 | 76 | 57 | 0.00 | 0.294 | 76 | 65 | 75 | 51 |
| Wed | 16 | 78 | 52 | 38 | 38 | Trace | 0.163 | 74 | 64 | 74 | 51 |
| Thu | 17 | 74 | 48 | 74 | 41 | 0.11 | 0.083 | 64 | 59 | 65 | 50 |
| Fri | 18 | 72 | 48 | 121 | 83 | 0.00 | 0.255 | 61 | 58 | 65 | 48 |
| Sat | 19 | 67 | 39 | 119 | 84 | 0.72 | 0.000 | 61 | 50 | 58 | 44 |
| Sun | 20 | 57 | 41 | 47 | 26 | 0.73 | 0.278 | 50 | 50 | 57 | 44 |
| Mon | 21 | 55 | 33 | 36 | 22 | 0.00 | 0.081 | 59 | 47 | 62 | 42 |
| Tue | 22 | 58 | 37 | 38 | 23 | 0.00 | 0.104 | 60 | 45 | 65 | 41 |
| Wed | 23 | 66 | 42 | 32 | 21 | 0.00 | 0.105 | 63 | 47 | 69 | 44 |
| Thu | 24 | 71 | 42 | 29 | 17 | 0.00 | 0.023 | 65 | 48 | 71 | 46 |
| Fri | 25 | 70 | 42 | 53 | 32 | 0.00 | 0.201 | 66 | 49 | 68 | 46 |
| Sat | 26 | 75 | 44 | 64 | 34 | 0.00 | 0.190 | 66 | 50 | 69 | 45 |
| Sun | 27 | 76 | 42 | 28 | 21 | 0.00 | 0.185 | 66 | 53 | 70 | 46 |
| Mon | 28 | 76 | 45 | 15 | 15 | 0.00 | 0.143 | 66 | 53 | 68 | 48 |
| Tue | 29 | 73 | 48 | 63 | 57 | 0.00 | 0.124 | 62 | 52 | 63 | 48 |
| Wed | 30 | 58 | 33 | 70 | 56 | 0.01 | 0.185 | 63 | 49 | 63 | 41 |
| Thu | 31 | 48 | 25 | 70 | 50 | 0.00 | 0.238 | 56 | 42 | 54 | 37 |
| October Precip. Total/Evap. Average |
1.57 | 0.203 | |||||||||
| Maximum (2.0 meter) and Minimum (0.25 meter) wind speed is recorded in miles per day. The data is reported to the National Weather Service over a 24 hour period from 8:00 a.m. previous day to 8:00 a.m. present day. |
|||||||||||
NMSU ASC Farmington Daily Weather Data September 2024
| Day | Date |
Air Temp
|
Wind Speed
|
Precipitation
|
Evaporation
|
Soil Temp
|
Water Temp
|
||||
|---|---|---|---|---|---|---|---|---|---|---|---|
| Max | Min | 2.0m | 0.25m | Inches | Inches | Max | Min | Max | Min | ||
| Sun | 01 | 85 | 61 | 47 | 42 | 0.00 | 0.267 | 89 | 72 | 83 | 59 |
| Mon | 02 | 87 | 60 | 91 | 68 | 0.00 | 0.419 | 91 | 72 | 85 | 58 |
| Tue | 03 | 84 | 58 | 35 | 36 | 0.00 | 0.454 | 91 | 73 | 86 | 59 |
| Wed | 04 | 86 | 56 | 32 | 34 | 0.00 | 0.538 | 91 | 72 | 90 | 59 |
| Thu | 05 | 86 | 51 | 51 | 46 | 0.00 | 0.380 | 91 | 73 | 84 | 58 |
| Fri | 06 | 83 | 44 | 99 | 73 | 0.00 | 0.371 | 88 | 72 | 80 | 57 |
| Sat | 07 | 84 | 60 | 50 | 43 | 0.00 | 0.182 | 90 | 71 | 84 | 57 |
| Sun | 08 | 86 | 59 | 51 | 46 | 0.00 | 0.387 | 90 | 72 | 86 | 59 |
| Mon | 09 | 85 | 53 | 42 | 40 | 0.00 | 0.463 | 92 | 72 | 82 | 57 |
| Tue | 10 | 84 | 54 | 42 | 39 | 0.00 | 0.476 | 89 | 71 | 85 | 57 |
| Wed | 11 | 84 | 60 | 51 | 46 | 0.00 | 0.363 | 88 | 72 | 83 | 58 |
| Thu | 12 | 85 | 53 | 52 | 50 | 0.00 | 0.308 | 87 | 71 | 82 | 55 |
| Fri | 13 | 85 | 51 | 67 | 62 | 0.00 | 0.405 | 80 | 70 | 81 | 55 |
| Sat | 14 | 84 | 50 | 36 | 31 | 0.00 | 0.171 | 86 | 70 | 82 | 55 |
| Sun | 15 | 86 | 53 | 34 | 30 | 0.02 | 0.325 | 86 | 69 | 83 | 55 |
| Mon | 16 | 84 | 58 | 114 | 87 | 0.08 | 0.474 | 83 | 70 | 79 | 58 |
| Tue | 17 | 79 | 59 | 178 | 161 | 0.02 | 0.357 | 73 | 69 | 76 | 58 |
| Wed | 18 | 78 | 44 | 82 | 68 | 0.19 | 0.293 | 77 | 61 | 76 | 51 |
| Thu | 19 | 77 | 47 | 31 | 28 | 0.00 | 0.179 | 82 | 60 | 79 | 50 |
| Fri | 20 | 81 | 50 | 38 | 32 | 0.00 | 0.432 | 83 | 63 | 80 | 54 |
| Sat | 21 | 84 | 49 | 49 | 48 | 0.00 | 0.401 | 85 | 65 | 81 | 54 |
| Sun | 22 | 73 | 43 | 84 | 65 | 0.00 | 0.073 | 77 | 62 | 71 | 51 |
| Mon | 23 | 71 | 48 | 25 | 24 | 0.00 | 0.268 | 78 | 61 | 75 | 53 |
| Tue | 24 | 77 | 45 | 25 | 27 | 0.00 | 0.223 | 81 | 63 | 80 | 53 |
| Wed | 25 | 81 | 51 | 27 | 28 | 0.00 | 0.273 | 82 | 64 | 81 | 53 |
| Thu | 26 | 88 | 58 | 42 | 39 | 0.00 | 0.425 | 82 | 65 | 82 | 55 |
| Fri | 27 | 81 | 54 | 39 | 37 | 0.00 | 0.302 | 83 | 67 | 81 | 56 |
| Sat | 28 | 86 | 58 | 44 | 42 | 0.00 | 0.230 | 83 | 67 | 81 | 55 |
| Sun | 29 | 88 | 52 | 69 | 56 | 0.00 | 0.314 | 84 | 67 | 83 | 57 |
| Mon | 30 | 86 | 50 | 30 | 30 | Trace | 0.443 | 82 | 62 | 79 | 57 |
| September Precip. Total/Evap. Average |
0.31 | 0.343 | |||||||||
| Maximum (2.0 meter) and Minimum (0.25 meter) wind speed is recorded in miles per day. The data is reported to the National Weather Service over a 24 hour period from 8:00 a.m. previous day to 8:00 a.m. present day. |
|||||||||||
NMSU ASC Farmington Daily Weather Data August 2024
| Day | Date |
Air Temp
|
Wind Speed
|
Precipitation
|
Evaporation
|
Soil Temp
|
Water Temp
|
||||
|---|---|---|---|---|---|---|---|---|---|---|---|
| Max | Min | 2.0m | 0.25m | Inches | Inches | Max | Min | Max | Min | ||
| Thu | 01 | 94 | 64 | 35 | 30 | 0.00 | 0.532 | 97 | 79 | 92 | 64 |
| Fri | 02 | 96 | 61 | 66 | 59 | 0.00 | 0.402 | 97 | 81 | 97 | 66 |
| Sat | 03 | 94 | 64 | 71 | 60 | 0.00 | 0.494 | 100 | 84 | 94 | 67 |
| Sun | 04 | 94 | 61 | 65 | 34 | 0.00 | 0.535 | 99 | 87 | 95 | 66 |
| Mon | 05 | 92 | 65 | 31 | 33 | 0.00 | 0.389 | 99 | 83 | 95 | 68 |
| Tue | 06 | 93 | 70 | 52 | 49 | 0.00 | 0.544 | 98 | 52 | 93 | 68 |
| Wed | 07 | 95 | 62 | 61 | 55 | 0.14 | 0.251 | 99 | 79 | 95 | 66 |
| Thu | 08 | 93 | 61 | 67 | 56 | 0.00 | 0.404 | 97 | 78 | 91 | 67 |
| Fri | 09 | 91 | 54 | 49 | 48 | 0.21 | 0.469 | 98 | 76 | 94 | 66 |
| Sat | 10 | 86 | 62 | 57 | 45 | 0.15 | 0.124 | 92 | 75 | 90 | 67 |
| Sun | 11 | 84 | 62 | 40 | 28 | 0.10 | 0.448 | 91 | 73 | 89 | 68 |
| Mon | 12 | 84 | 58 | 68 | 46 | 0.00 | 0.317 | 94 | 70 | 92 | 66 |
| Tue | 13 | 85 | 60 | 85 | 67 | 0.00 | 0.414 | 96 | 73 | 92 | 65 |
| Wed | 14 | 81 | 56 | 55 | 44 | 0.04 | 0.296 | 86 | 71 | 80 | 64 |
| Thu | 15 | 84 | 55 | 51 | 42 | 0.02 | 0.424 | 94 | 75 | 89 | 63 |
| Fri | 16 | 91 | 59 | 31 | 32 | 0.00 | 0.366 | 95 | 73 | 90 | 63 |
| Sat | 17 | 92 | 62 | 58 | 50 | 0.00 | 0.163 | 97 | 75 | 91 | 65 |
| Sun | 18 | 92 | 59 | 72 | 61 | 0.03 | 0.641 | 97 | 77 | 92 | 65 |
| Mon | 19 | 84 | 64 | 73 | 54 | 0.00 | 0.340 | 89 | 71 | 85 | 67 |
| Tue | 20 | 89 | 60 | 35 | 29 | 0.00 | 0.310 | 94 | 78 | 93 | 67 |
| Wed | 21 | 94 | 69 | 57 | 50 | Trace | 0.310 | 95 | 76 | 93 | 67 |
| Thu | 22 | 92 | 56 | 51 | 45 | 0.11 | 0.336 | 97 | 74 | 95 | 64 |
| Fri | 23 | 81 | 51 | 60 | 46 | 0.52 | 0.270 | 87 | 70 | 84 | 65 |
| Sat | 24 | 83 | 58 | 63 | 39 | 0.59 | 0.256 | 90 | 68 | 89 | 63 |
| Sun | 25 | 80 | 58 | 79 | 44 | 0.03 | 0.300 | 79 | 64 | 82 | 65 |
| Mon | 26 | 85 | 61 | 78 | 43 | 0.00 | 0.235 | 86 | 66 | 86 | 63 |
| Tue | 27 | 85 | 60 | 51 | 39 | 0.00 | 0.324 | 91 | 68 | 91 | 63 |
| Wed | 28 | 85 | 62 | 59 | 43 | 0.00 | 0.242 | 92 | 63 | 91 | 63 |
| Thu | 29 | 83 | 55 | 67 | 56 | 0.00 | 0.260 | 88 | 71 | 84 | 60 |
| Fri | 30 | 83 | 57 | 57 | 46 | 0.00 | 0.459 | 91 | 70 | 87 | 59 |
| Sat | 31 | 86 | 60 | 79 | 57 | 0.00 | 0.276 | 92 | 71 | 86 | 59 |
| August Precip. Total/Evap. Average |
1.94 | 0.355 | |||||||||
|
Maximum (2.0 meter) and Minimum (0.25 meter) wind speed is recorded in miles per day. |
|||||||||||
NMSU ASC Farmington Daily Weather Data July 2024
| Day | Date |
Air Temp
|
Wind Speed
|
Precipitation
|
Evaporation
|
Soil Temp
|
Water Temp
|
||||
|---|---|---|---|---|---|---|---|---|---|---|---|
| Max | Min | 2.0m | 0.25m | Inches | Inches | Max | Min | Max | Min | ||
| Mon | 01 | 90 | 62 | 71 | 50 | 0.45 | 0.444 | 95 | 72 | 93 | 65 |
| Tue | 02 | 82 | 60 | 65 | 35 | 0.32 | 0.234 | 85 | 70 | 84 | 64 |
| Wed | 03 | 86 | 60 | 64 | 38 | 0.00 | 0.326 | 91 | 69 | 91 | 64 |
| Thu | 04 | 88 | 56 | 56 | 41 | 0.00 | 0.521 | 95 | 71 | 91 | 62 |
| Fri | 05 | 88 | 49 | 76 | 58 | 0.00 | 0.528 | 93 | 71 | 86 | 57 |
| Sat | 06 | 88 | 54 | 79 | 59 | 0.00 | 0.562 | 93 | 70 | 85 | 57 |
| Sun | 07 | 88 | 56 | 77 | 61 | 0.00 | 0.359 | 92 | 71 | 84 | 57 |
| Mon | 08 | 91 | 53 | 69 | 56 | 0.00 | 0.557 | 92 | 71 | 86 | 57 |
| Tue | 09 | 88 | 62 | 70 | 51 | 0.00 | 0.426 | 93 | 72 | 91 | 59 |
| Wed | 10 | 90 | 60 | 41 | 35 | 0.00 | 0.320 | 94 | 74 | 93 | 63 |
| Thu | 11 | 92 | 61 | 52 | 43 | 0.00 | 0.534 | 95 | 76 | 94 | 63 |
| Fri | 12 | 94 | 60 | 67 | 52 | 0.00 | 0.490 | 92 | 77 | 91 | 63 |
| Sat | 13 | 94 | 61 | 74 | 57 | 0.00 | 0.308 | 93 | 78 | 95 | 62 |
| Sun | 14 | 96 | 67 | 54 | 42 | 0.00 | 0.574 | 96 | 78 | 95 | 64 |
| Mon | 15 | 96 | 64 | 52 | 42 | 0.01 | 0.424 | 98 | 80 | 95 | 67 |
| Tue | 16 | 94 | 64 | 41 | 36 | 0.00 | 0.568 | 97 | 82 | 93 | 67 |
| Wed | 17 | 91 | 65 | 56 | 42 | 0.00 | 0.403 | 96 | 82 | 91 | 66 |
| Thu | 18 | 93 | 66 | 87 | 64 | 0.00 | 0.445 | 98 | 81 | 95 | 65 |
| Fri | 19 | 90 | 61 | 69 | 60 | 0.00 | 0.345 | 96 | 83 | 93 | 65 |
| Sat | 20 | 92 | 65 | 57 | 51 | 0.00 | 0.327 | 97 | 82 | 96 | 65 |
| Sun | 21 | 88 | 65 | 61 | 59 | 0.00 | 0.627 | 95 | 82 | 93 | 66 |
| Mon | 22 | 86 | 59 | 74 | 59 | 0.00 | 0.391 | 93 | 80 | 91 | 61 |
| Tue | 23 | 87 | 63 | 62 | 52 | 0.00 | 0.278 | 93 | 79 | 91 | 62 |
| Wed | 24 | 90 | 66 | 49 | 42 | 0.00 | 0.405 | 95 | 79 | 92 | 64 |
| Thu | 25 | 94 | 66 | 55 | 49 | 0.00 | 0.409 | 95 | 81 | 93 | 65 |
| Fri | 26 | 95 | 52 | 81 | 63 | Trace | 0.472 | 96 | 81 | 95 | 66 |
| Sat | 27 | 89 | 65 | 94 | 73 | 0.00 | 0.319 | 96 | 80 | 91 | 66 |
| Sun | 28 | 91 | 60 | 47 | 40 | 0.10 | 0.523 | 95 | 78 | 91 | 65 |
| Mon | 29 | 90 | 60 | 49 | 43 | 0.00 | 0.550 | 94 | 79 | 91 | 63 |
| Tue | 30 | 91 | 60 | 41 | 35 | 0.00 | 0.463 | 92 | 79 | 86 | 63 |
| Wed | 31 | 91 | 58 | 48 | 39 | 0.00 | 0.352 | 95 | 79 | 89 | 63 |
| July Precip. Total/Evap. Average |
0.88 | 0.407 | |||||||||
| Maximum (2.0 meter) and Minimum (0.25 meter) wind speed is recorded in miles per day. The data is reported to the National Weather Service over a 24 hour period from 8:00 a.m. previous day to 8:00 a.m. present day. |
|||||||||||
NMSU ASC Farmington Daily Weather Data June 2024
| Day | Date |
Air Temp
|
Wind Speed
|
Precipitation
|
Evaporation
|
Soil Temp
|
Water Temp
|
||||
|---|---|---|---|---|---|---|---|---|---|---|---|
| Max | Min | 2.0m | 0.25m | Inches | Inches | Max | Min | Max | Min | ||
| Sat | 1 | 85 | 54 | 55 | 42 | 0.00 | 0.290 | 85 | 68 | 86 | 55 |
| Sun | 2 | 89 | 52 | 66 | 53 | 0.00 | 0.408 | 86 | 69 | 84 | 54 |
| Mon | 3 | 84 | 51 | 57 | 46 | 0.00 | 0.618 | 85 | 68 | 86 | 54 |
| Tue | 4 | 86 | 56 | 61 | 50 | 0.00 | 0.334 | 87 | 69 | 85 | 54 |
| Wed | 5 | 85 | 54 | 118 | 89 | 0.00 | 0.502 | 86 | 71 | 82 | 56 |
| Thu | 6 | 89 | 50 | 74 | 59 | 0.00 | 0.510 | 89 | 70 | 87 | 57 |
| Fri | 7 | 92 | 51 | 62 | 46 | 0.00 | 0.363 | 90 | 71 | 89 | 58 |
| Sat | 8 | 94 | 58 | 71 | 55 | 0.00 | 0.364 | 88 | 74 | 85 | 59 |
| Sun | 9 | 92 | 56 | 64 | 50 | 0.00 | 0.510 | 90 | 74 | 89 | 59 |
| Mon | 10 | 90 | 66 | 57 | 43 | 0.00 | 0.498 | 90 | 73 | 90 | 62 |
| Tue | 11 | 80 | 55 | 65 | 49 | 0.00 | 0.290 | 85 | 73 | 80 | 60 |
| Wed | 12 | 88 | 60 | 68 | 52 | 0.00 | 0.583 | 91 | 73 | 90 | 61 |
| Thu | 13 | 95 | 59 | 54 | 42 | 0.00 | 0.427 | 93 | 75 | 90 | 60 |
| Fri | 14 | 93 | 53 | 120 | 87 | 0.06 | 0.547 | 92 | 75 | 91 | 60 |
| Sat | 15 | 80 | 53 | 71 | 61 | 0.05 | 0.189 | 80 | 70 | 75 | 58 |
| Sun | 16 | 90 | 57 | 42 | 38 | 0.00 | 0.361 | 90 | 74 | 89 | 58 |
| Mon | 17 | 92 | 56 | 44 | 38 | 0.00 | 0.472 | 92 | 72 | 89 | 58 |
| Tue | 18 | 90 | 60 | 98 | 76 | 0.00 | 0.476 | 93 | 73 | 87 | 56 |
| Wed | 19 | 82 | 53 | 66 | 53 | 0.00 | 0.508 | 92 | 74 | 84 | 56 |
| Thu | 20 | 91 | 65 | 180 | 130 | 0.00 | 0.427 | 91 | 73 | 86 | 58 |
| Fri | 21 | 86 | 60 | 145 | 88 | 0.64 | 0.578 | 89 | 68 | 86 | 62 |
| Sat | 22 | 85 | 60 | 91 | 52 | 0.57 | 0.287 | 89 | 66 | 85 | 62 |
| Sun | 23 | 83 | 62 | 44 | 18 | 0.00 | 0.340 | 84 | 79 | 86 | 63 |
| Mon | 24 | 88 | 61 | 44 | 35 | 0.00 | 0.378 | 90 | 69 | 92 | 67 |
| Tue | 25 | 89 | 63 | 45 | 35 | 0.00 | 0.372 | 96 | 72 | 93 | 67 |
| Wed | 26 | 94 | 69 | 43 | 37 | 0.00 | 0.388 | 99 | 75 | 96 | 68 |
| Thu | 27 | 88 | 67 | 67 | 53 | Trace | 0.338 | 93 | 78 | 87 | 68 |
| Fri | 28 | 85 | 58 | 69 | 51 | 0.11 | 0.440 | 89 | 69 | 86 | 62 |
| Sat | 29 | 87 | 64 | 47 | 30 | 0.00 | 0.224 | 95 | 69 | 91 | 68 |
| Sun | 30 | 89 | 65 | 65 | 52 | 0.00 | 0.420 | 92 | 76 | 89 | 67 |
| June Precip. Total/ Evap. Average |
1.43 | 0.368 | |||||||||
| Maximum (2.0 meter) and Minimum (0.25 meter) wind speed is recorded in miles per day. The data is reported to the National Weather Service over a 24 hour period from 8:00 a.m. previous day to 8:00 a.m. present day. |
|||||||||||
NMSU ASC Farmington Daily Weather Data May 2024
| Day | Date |
Air Temp
|
Wind Speed
|
Precipitation
|
Evaporation
|
Soil Temp
|
Water Temp
|
||||
|---|---|---|---|---|---|---|---|---|---|---|---|
| Max | Min | 2.0m | 0.25m | Inches | Inches | Max | Min | Max | Min | ||
| Wed | 01 | 74 | 44 | 72 | 61 | 0.00 | 0.447 | 76 | 56 | 78 | 48 |
| Thu | 02 | 73 | 36 | 94 | 19 | 0.00 | 0.487 | 75 | 58 | 77 | 46 |
| Fri | 03 | 67 | 37 | 99 | 78 | 0.00 | 0.257 | 73 | 57 | 73 | 44 |
| Sat | 04 | 74 | 37 | 60 | 55 | 0.00 | 0.354 | 71 | 56 | 77 | 44 |
| Sun | 05 | 76 | 49 | 148 | 107 | 0.00 | 0.376 | 74 | 59 | 74 | 48 |
| Mon | 06 | 71 | 29 | 177 | 144 | 0.00 | 0.389 | 66 | 55 | 59 | 39 |
| Tue | 07 | 59 | 33 | 123 | 90 | 0.00 | 0.324 | 70 | 54 | 68 | 39 |
| Wed | 08 | 69 | 34 | 167 | 118 | 0.00 | 0.481 | 71 | 54 | 72 | 40 |
| Thu | 09 | 58 | 35 | 126 | 91 | 0.00 | 0.375 | 69 | 55 | 67 | 39 |
| Fri | 10 | 66 | 37 | 86 | 61 | 0.00 | 0.310 | 71 | 54 | 73 | 43 |
| Sat | 11 | 71 | 47 | 104 | 76 | 0.00 | 0.117 | 71 | 56 | 74 | 45 |
| Sun | 12 | 69 | 40 | 129 | 98 | 0.00 | 0.353 | 71 | 59 | 71 | 47 |
| Mon | 13 | 73 | 38 | 153 | 108 | 0.00 | 0.482 | 73 | 58 | 75 | 48 |
| Tue | 14 | 76 | 49 | 74 | 52 | 0.00 | 0.399 | 76 | 54 | 81 | 48 |
| Wed | 15 | 77 | 47 | 65 | 47 | 0.00 | 0.274 | 77 | 61 | 81 | 52 |
| Thu | 16 | 74 | 43 | 83 | 58 | 0.00 | 0.369 | 73 | 61 | 73 | 50 |
| Fri | 17 | 73 | 47 | 77 | 60 | 0.00 | 0.303 | 76 | 60 | 78 | 51 |
| Sat | 18 | 79 | 48 | 90 | 75 | 0.00 | 0.427 | 79 | 62 | 79 | 52 |
| Sun | 19 | 81 | 51 | 48 | 45 | 0.00 | 0.365 | 80 | 64 | 86 | 54 |
| Mon | 20 | 78 | 46 | 88 | 74 | 0.00 | 0.550 | 81 | 65 | 82 | 50 |
| Tue | 21 | 77 | 44 | 101 | 84 | 0.00 | 0.231 | 73 | 62 | 73 | 46 |
| Wed | 22 | 78 | 36 | 132 | 94 | 0.00 | 0.353 | 76 | 60 | 75 | 43 |
| Thu | 23 | 75 | 48 | 91 | 61 | 0.00 | 0.391 | 78 | 59 | 79 | 44 |
| Fri | 24 | 77 | 40 | 105 | 80 | 0.00 | 0.420 | 80 | 62 | 80 | 48 |
| Sat | 25 | 78 | 54 | N/D | N/D | 0.00 | 0.354 | 79 | 63 | N/D | N/D |
| Sun | 26 | 74 | 40 | 161 | 122 | 0.00 | 0.354 | 81 | 64 | 80 | 49 |
| Mon | 27 | 74 | 48 | 107 | 77 | 0.00 | 0.530 | 79 | 63 | 77 | 50 |
| Tue | 28 | 82 | 49 | 61 | 45 | 0.00 | 0.402 | 88 | 64 | 86 | 52 |
| Wed | 29 | 88 | 49 | 70 | 52 | 0.00 | 0.470 | 85 | 67 | 87 | 54 |
| Thu | 30 | 86 | 43 | 69 | 54 | 0.00 | 0.236 | 83 | 67 | 82 | 52 |
| Fri | 31 | 81 | 50 | 84 | 66 | 0.00 | 0.435 | 84 | 66 | 84 | 53 |
| May Precip. Total/ Evap. Average |
0.00 | 0.376 | |||||||||
| Maximum (2.0 meter) and Minimum (0.25 meter) wind speed is recorded in miles per day. The data is reported to the National Weather Service over a 24 hour period from 8:00 a.m. previous day to 8:00 a.m. present day. |
|||||||||||
-
NMSU ASC Farmington Daily Weather Data April 2024
Day Date Air TempWind SpeedPrecipitationEvaporationSoil TempWater TempMax Min 2.0m 0.25m Inches Inches Max Min Max Min Mon 01 59 29 128 104 0.06 N/A 57 42 N/A N/A Tue 02 51 23 120 81 0.00 0.085 56 41 61 38 Wed 03 61 30 91 67 0.00 0.341 63 41 66 38 Thu 04 67 36 69 56 0.00 0.274 67 44 70 39 Fri 05 74 44 123 93 0.00 0.261 68 47 71 41 Sat 06 70 31 194 158 0.00 0.654 67 49 68 39 Sun 07 47 20 147 109 0.00 0.307 58 43 61 37 Mon 08 53 29 83 62 0.00 0.237 61 42 63 39 Tue 09 58 30 46 37 0.00 0.074 56 44 55 37 Wed 10 61 33 110 83 0.00 0.294 64 43 67 37 Thu 11 64 30 136 100 0.00 0.443 65 46 68 39 Fri 12 68 40 78 59 0.00 0.304 65 46 71 39 Sat 13 77 41 69 60 0.00 0.222 69 53 73 42 Sun 14 73 39 36 32 0.00 0.348 73 54 78 45 Mon 15 75 37 87 72 0.00 0.348 72 54 77 41 Tue 16 55 31 80 63 0.00 0.260 65 50 64 39 Wed 17 63 37 108 84 0.00 0.187 67 49 70 39 Thu 18 73 41 81 63 0.00 0.369 70 51 75 43 Fri 19 73 44 70 N/D 0.00 0.344 72 54 75 46 Sat 20 74 39 53 44 0.00 0.137 74 58 77 48 Sun 21 73 40 89 N/D 0.00 0.428 74 55 76 47 Mon 22 72 42 86 64 0.00 0.413 74 57 86 64 Tue 23 76 44 57 47 0.00 0.313 75 57 76 45 Wed 24 80 42 57 48 0.00 0.474 76 60 82 48 Thu 25 78 39 89 69 0.00 0.409 78 61 80 46 Fri 26 67 36 75 55 0.00 0.288 62 56 62 42 Sat 27 62 38 124 99 0.13 0.032 64 52 63 42 Sun 28 55 38 70 53 0.08 0.254 60 51 60 42 Mon 29 62 33 109 17 0.00 0.218 69 50 72 44 Tue 30 70 40 48 41 0.00 0.195 74 51 77 45 April Precip. Total/ Evap. Avg. 0.27 0.279 Maximum (2.0 meter) and Minimum (0.25 meter) wind speed is recorded in miles per day.
The data is reported to the National Weather Service over a 24 hour period from 8:00 a.m. previous day to 8:00 a.m. present day.-
-
NMSU ASC Farmington Daily Weather Data March 2024
Day Date Air TempWind SpeedPrecipitationEvaporationSoil TempWater TempMax Min 2.0m 0.25m Inches Inches Max Min Max Min Fri 01 57 27 44 39 0.00 N/A 53 36 N/A N/A Sat 02 62 29 54 45 0.00 N/A 56 40 N/A N/A Sun 03 64 41 118 98 0.00 N/A 55 41 N/A N/A Mon 04 61 25 74 61 0.00 N/A 56 43 N/A N/A Tue 05 56 25 33 29 0.00 N/A 56 42 N/A N/A Wed 06 59 26 41 33 0.00 N/A 57 41 N/A N/A Thu 07 57 30 37 33 0.00 N/A 57 42 N/A N/A Fri 08 52 23 61 49 0.00 N/A 53 44 N/A N/A Sat 09 54 24 105 77 0.00 N/A 54 41 N/A N/A Sun 10 53 20 43 34 0.00 N/A 51 41 N/A N/A Mon 11 58 27 45 40 0.00 N/A 57 45 N/A N/A Tue 12 63 30 38 34 0.00 N/A 56 44 N/A N/A Wed 13 61 32 65 52 0.02 N/A 57 44 N/A N/A Thu 14 53 20 63 58 0.00 N/A 49 40 N/A N/A Fri 15 53 28 72 51 0.41 N/A 50 39 N/A N/A Sat 16 53 36 145 91 0.05 N/A 58 42 N/A N/A Sun 17 52 33 40 20 0.05 N/A 55 42 N/A N/A Mon 18 50 31 36 13 Trace N/A 46 39 N/A N/A Tue 19 59 32 55 26 0.00 N/A 59 38 N/A N/A Wed 20 58 31 51 37 0.00 N/A 60 43 N/A N/A Thu 21 65 32 61 41 0.00 N/A 64 43 N/A N/A Fri 22 63 33 90 68 0.00 N/A 64 45 N/A N/A Sat 23 64 38 56 44 0.00 N/A 61 46 N/A N/A Sun 24 63 33 85 71 0.05 N/A 61 49 N/A N/A Mon 25 42 31 80 49 0.30 N/A 49 39 N/A N/A Tue 26 46 28 169 121 0.00 N/A 51 38 N/A N/A Wed 27 47 25 76 62 Trace N/A 52 38 N/A N/A Thu 28 49 29 121 89 0.00 N/A 55 37 N/A N/A Fri 29 64 35 48 38 0.00 N/A 61 48 N/A N/A Sat 30 64 41 48 38 0.00 N/A 61 48 N/A N/A Sun 31 69 39 107 88 0.00 N/A 64 48 N/A N/A March Precipitation Total 0.88 inches Maximum (2.0 meter) and Minimum (0.25 meter) wind speed is recorded in miles per day.
The data is reported to the National Weather Service over a 24 hour period from 8:00 a.m. previous day to 8:00 a.m. present day.NMSU ASC Farmington Daily Weather Data February 2024
Day Date Air TempWind SpeedPrecipitationEvaporationSoil TempWater TempMax Min 2.0m 0.25m Inches Inches Max Min Max Min Thu 01 60 34 32 31 0.00 N/A 50 35 N/A N/A Fri 02 62 38 57 45 0.10 N/A 49 40 N/A N/A Sat 03 43 31 82 49 0.05 N/A 43 38 N/A N/A Sun 04 45 24 142 95 0.00 N/A 41 34 N/A N/A Mon 05 44 26 59 40 0.00 N/A 42 34 N/A N/A Tue 06 58 31 64 40 0.00 N/A 45 34 N/A N/A Wed 07 57 34 137 109 0.00 N/A 43 40 N/A N/A Thu 08 48 28 107 83 0.00 N/A 44 37 N/A N/A Fri 09 42 21 66 37 0.08 N/A 41 36 N/A N/A Sat 10 40 26 48 33 0.00 N/A 42 35 N/A N/A Sun 11 35 20 97 79 0.00 N/A 36 34 N/A N/A Mon 12 40 14 79 60 0.00 N/A 41 33 N/A N/A Tue 13 43 20 42 32 0.00 N/A 41 33 N/A N/A Wed 14 53 25 31 22 0.00 N/A 45 33 N/A N/A Thu 15 51 25 62 46 0.00 N/A 47 30 N/A N/A Fri 16 57 22 49 36 0.00 N/A 47 35 N/A N/A Sat 17 51 23 59 47 0.00 N/A 49 36 N/A N/A Sun 18 47 22 93 69 0.00 N/A 46 36 N/A N/A Mon 19 54 26 58 42 0.00 N/A 48 36 N/A N/A Tue 20 63 35 33 26 0.00 N/A 51 35 N/A N/A Wed 21 64 39 66 55 0.00 N/A 55 41 N/A N/A Thu 22 60 29 71 64 0.00 N/A 53 41 N/A N/A Fri 23 53 19 101 74 0.00 N/A 51 37 N/A N/A Sat 24 53 23 52 40 0.00 N/A 51 48 N/A N/A Sun 25 54 27 41 31 0.00 N/A 50 37 N/A N/A Mon 26 62 39 50 44 0.00 N/A 53 39 N/A N/A Tue 27 63 40 139 112 0.00 N/A 52 45 N/A N/A Wed 28 55 13 134 104 0.00 N/A 52 37 N/A N/A Thu 29 52 21 30 28 0.00 N/A 51 36 N/A N/A February Precipitation Total 0.23 inches Maximum (2.0 meter) and Minimum (0.25 meter) wind speed is recorded in miles per day.
The data is reported to the National Weather Service over a 24 hour period from 8:00 a.m. previous day to 8:00 a.m. present day. -
NMSU ASC Farmington Daily Weather Data January 2024
Day Date Air TempWind SpeedPrecipitationEvaporationSoil TempWater TempMax Min 2.0m 0.25m Inches Inches Max Min Max Min Mon 01 44 20 39 33 0.00 N/A 33 30 N/A N/A Tue 02 46 17 19 18 0.00 N/A 33 31 N/A N/A Wed 03 43 15 33 31 0.00 N/A 34 32 N/A N/A Thu 04 52 26 36 32 0.38 N/A 34 27 N/A N/A Fri 05 34 23 145 97 0.00 N/A 34 33 N/A N/A Sat 06 34 17 112 87 0.00 N/A 35 34 N/A N/A Sun 07 33 18 72 65 0.02 N/A 33 32 N/A N/A Mon 08 31 18 192 149 0.01 N/A 32 31 N/A N/A Tue 09 28 07 220 158 0.00 N/A 32 31 N/A N/A Wed 10 28 10 34 26 0.00 N/A 30 28 N/A N/A Thu 11 36 13 29 24 0.10 N/A 27 24 N/A N/A Fri 12 30 01 120 93 0.01 N/A 29 26 N/A N/A Sat 13 31 05 15 25 0.00 N/A 25 23 N/A N/A Sun 14 42 15 26 23 Trace N/A 29 24 N/A N/A Mon 15 48 21 20 22 0.00 N/A 30 29 N/A N/A Tue 16 40 16 23 21 0.00 N/A 30 28 N/A N/A Wed 17 38 18 63 49 0.00 N/A 30 27 N/A N/A Thu 18 39 23 30 25 0.00 N/A 30 24 N/A N/A Fri 19 44 27 50 41 0.00 N/A 30 30 N/A N/A Sat 20 48 28 46 31 0.00 N/A 35 32 N/A N/A Sun 21 53 35 23 12 0.08 N/A 38 33 N/A N/A Mon 22 44 33 01 00 0.03 N/A 40 37 N/A N/A Tue 23 51 31 28 02 0.00 N/A 36 34 N/A N/A Wed 24 47 32 22 09 0.03 N/A 36 30 N/A N/A Thu 25 48 29 24 05 0.01 N/A 44 37 N/A N/A Fri 26 40 33 16 09 0.03 N/A 39 36 N/A N/A Sat 27 50 21 62 33 0.00 N/A 45 34 N/A N/A Sun 28 48 26 29 24 0.00 N/A 43 34 N/A N/A Mon 29 50 25 19 20 0.00 N/A 44 34 N/A N/A Tue 30 51 27 28 28 0.00 N/A 44 34 N/A N/A Wed 31 59 31 36 34 0.00 N/A 47 35 N/A N/A January Precipitation Total 0.71 inches Maximum (2.0 meter) and Minimum (0.25 meter) wind speed is recorded in miles per day.
The data is reported to the National Weather Service over a 24 hour period from 8:00 a.m. previous day to 8:00 a.m. present day.Weather Data Summary
2025 Weather Data Summary January
-
2024 Weather Data Summary January - December
Corn Growing Degree Days
2024 Corn Growing Degree Days Data Table
Date GDD Date GDD Date GDD Date GDD Date GDD Date GDD Date GDD Total Apr May Jun Jul Aug Sep Oct 1 1 1 11 1 19 1 21 1 24 1 23 1 20 118 2 5 2 9 2 17 2 23 2 25 2 21 2 17 117 3 9 3 12 3 21 3 21 3 24 3 21 3 17 124 4 12 4 13 4 19 4 18 4 26 4 18 4 18 124 5 10 5 10 5 18 5 20 5 28 5 16 5 15 118 6 0 6 4 6 19 6 21 6 24 6 22 6 15 105 7 1 7 10 7 22 7 20 7 23 7 22 7 15 113 8 4 8 4 8 21 8 24 8 20 8 19 8 15 107 9 6 9 8 9 26 9 23 9 24 9 19 9 16 121 10 7 10 10 10 17 10 24 10 17 10 22 10 13 110 11 9 11 9 11 23 11 23 11 21 11 19 11 18 122 12 14 12 11 12 23 12 24 12 22 12 18 12 16 127 13 11 13 13 13 20 13 26 13 19 13 17 13 19 125 14 12 14 14 14 17 14 25 14 20 14 19 14 16 122 15 3 15 12 15 22 15 25 15 23 15 21 15 15 120 16 7 16 12 16 21 16 25 16 24 16 19 16 12 119 16 12 17 15 17 23 17 26 17 22 17 14 17 11 120 18 11 18 16 18 17 18 23 18 24 18 13 18 8 114 19 12 19 14 19 25 19 26 19 23 19 16 19 4 119 20 12 20 13 20 23 20 26 20 27 20 17 20 2 120 21 11 21 9 21 22 21 22 21 21 21 12 21 4 102 22 13 22 13 22 22 22 24 22 16 22 11 22 8 107 23 15 23 13 23 24 23 26 23 21 23 13 23 10 122 24 14 24 16 24 24 24 26 24 19 24 16 24 10 125 25 8 25 12 25 27 25 19 25 23 25 22 25 13 124 26 6 26 12 26 26 26 26 26 23 26 17 26 13 123 27 2 27 16 27 21 27 23 27 23 27 22 26 13 121 28 6 28 18 28 25 28 23 28 19 28 24 28 12 127 29 10 29 18 29 25 29 23 29 20 29 18 29 4 119 30 12 30 15 30 24 30 22 30 23 30 18 30 0 115 31 20 31 25 31 23 31 4 72 Total 254 382 655 722 689 549 372 Accumulative 636 1291 2014 2703 3251 3623 -
-
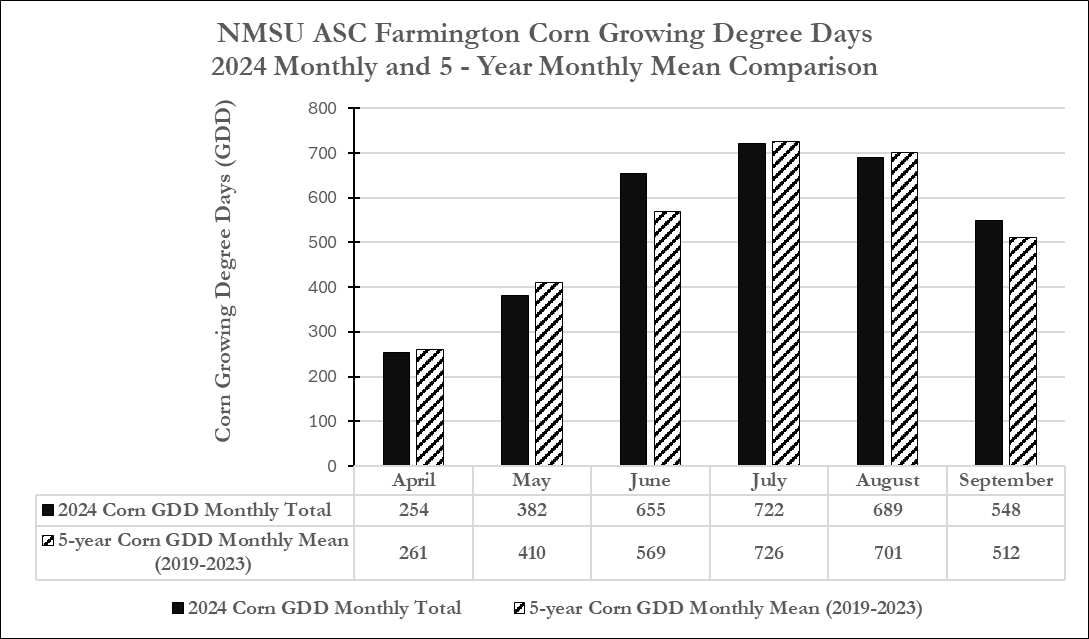
Monthly Total and 5-Year Monthly Average
Drought Map
Weather Data Download Instructions
National Weather Service
The National Oceanic and Atmospheric Administration U.S. Department of Commerce offers a weather data download service at this website: NOAA National Centers For Environmental Information. It links to the Climate Data Online Search webpage.
Select Weather Observation Type/Dataset
Select a Dataset from the drop-down arrow
Select: Data Range
Search for: Select Stations
Search Term: FARMINGTON AG SCIENCE CNT, NM US or other preference
Press Search
Press ‘Add to Cart’
Follow the remainder of site instruction
Note: Selection of the data download as the comma separate value (CSV) the data will download as a MS Excel Spreadsheet.
New Mexico Climate Center
The New Mexico Climate Center offers a weather data download service at this website: New Mexico Climate Center It provides Weather data available for download from 12 Stations. It also provides the Latest CoCoRaHS and Drought Status maps. It is recommended to read the Data Disclaimer on the home webpage for New Mexico Climate Center before proceeding with the weather (WX) data download process. The Contact information section provides information for contacting Dr. David DuBois, New Mexico State Climatologist with any questions you may have regarding the weather dataset(s).
On the Home webpage, select the Station preference. There are two options for WX data download a 'Data Request Form' and 'Download Latest 5 Minute Data'.
Data Request Form
Select Request option of WX data from the dropdown box at the arrow on the right.Select Start date by clicking on the date. A dropdown calendar will appear. Arrow left or right for month/year. Select start date. Repeat process for End date.
Select Output preference by clicking on the right down arrow. Choose from Graphical Plots, Table or Comma Separated Value. The later will automatically load data into a MS Excel spreadsheet.
Select Unit preference by clicking on the right down arrow. Choose English or metric.
Press Submit.
Note: The graphical Output will present WX data in graphics for Air Temperature, Relative Humidity, Max/Mean Wind Speed, Mean Wind Direction and Solar Radiation for the selected date.
Download Latest 5 Minute Data
Select from 24 Hours, 3 Days or 5 Days download options. This download process only presents WX data in a MS Excel spreadsheet format.Scroll upward to the browser upper right corner. The WX data will appear as a download box.
Select the dropdown box. The data will automatically appear on the screen in a MS Excel workbook which you can save for future use and reference.
Climatology
Plant growth and crop production are intrinsically linked to climate and daily weather conditions. Climate determines the types of plants that can be grown in a particular area and the management techniques required for successful landscapes and agricultural sustainability. Weather affects crop water requirements, timing of planting, cultivation, fertilization and harvest, crop tolerance to disease and pests, total crop yield and product quality. Agricultural and landscape planning begins with a thorough understanding of a locale's climate. To help provide this understanding for the Four Corners region, daily weather observations have been made since 1969 at the New Mexico State University (NMSU) Agricultural Science Center at Farmington (ASCF).
The ASCF is located in northwestern New Mexico (36 degrees 4' N Lat., 108 degrees 2' W Long.) about seven miles southwest of Farmington at an elevation of 5,640 feet above mean sea level. Two weather-data recording stations are located at the ASCF. Weather Station 1 (WS-1) was established at the center in January 1969 and was given an official designation by the National Weather Service (NWS) in 1978. Weather Station 2 (WS-2) was installed approximately 350 yards south of WS-1 in 1985. This is an automated, computer-linked station that is operated and maintained by the New Mexico Climate Center (NMCC) at NMSU in Las Cruces.
Fifty-three Years (1969-2021) of Climatological Data
Fifty-three Years (1969-2021) of Climatological Data
NMSU's Agricultural Science Center - Farmington weather data from the National Weather Service Station 1 (WS-1) and the New Mexico Climate Center Weather Station 2 (WS-2)Forty-eight Years (1969-2016) of Climatological Data
Forty-eight Years (1969-2016) of Climatological Data
NMSU's Agricultural Science Center - Farmington weather data from the National Weather Service Station 1 (WS-1) and the New Mexico Climate Center Weather Station 2 (WS-2)Forty-three Years (1969-2011) of Climatological Data
Forty-three Years (1969_2011) of Climatologic Data
NMSU's Agricultural Science Center - Farmington weather data from the National Weather Service Station 1 (WS-1) and the New Mexico Climate Center Weather Station 2 (WS-2)Weather Annual Data Report - 2024
Fifty-six Years (1969-2024) of Climatological Data:
NMSU Agricultural Science Center at Farmington
(rev. 21 January 2025)Margaret M. West, Research Scientist, Associate
-
Send email request for PDF file of this report to farmingt@nmsu.edu
IMPACT
Given the marginal precipitation—averaging around eight inches per year in the New Mexico Four Corners region—local industries and municipalities rely on surface water from the San Juan, Animas, and La Plata Rivers, which converge in Farmington, NM, and then flow into the Colorado River at Lake Powell in Utah. This water-use is regulated for natural resources, agricultural, industrial, municipal, and residential use. Diligent weather data collection and subsequent monitoring from the New Mexico State University Agricultural Science Center at Farmington’s National Weather Service Station 1 (WS-1) and the New Mexico Climate Center Station 2 (WS-2) is crucial to inform those interested in global and regional environments and local economic impacts within the region. Weather data are used by the U.S. Department of Agriculture Natural Resources Conservation Service (USDA–NRCS) San Juan District, large and small acreage agricultural producers, and municipalities for water demand planning and monitoring flood events, and by private end-users for irrigation scheduling. Additionally, both weather station datasets are used in agricultural research. This varying and ongoing need for weather data demonstrates the importance of long-term weather monitoring for the region.
INTRODUCTION
NMSU’s Agricultural Experiment Station–Agricultural Science Center at Farmington (ASCF) is located 8 miles southwest of Farmington, NM, at 5,640 feet above sea level (36°4’ N by 108° W) on 254 acres of land leased from the Navajo Nation. The daily weather data at ASCF have been recorded since 1969. The National Weather Service (NWS) designated WS-1 as an official climatological observation site in 1978. The WS-1 equipment is enclosed within a 5-foot-high chain link fence and mounted on the bare soil surface. Weather data are manually recorded during a 24-hour period from 8:00 a.m. to 8:00 a.m. Mountain Standard Time.
The New Mexico Climate Center (NMCC) designated WS-2 was established at ASCF in 1985. It is located approximately 383 yards south of WS-1. It is enclosed in a 5-foot-high chain link fence surrounded by turf. The weather equipment is mounted on a tripod within the fenced area, and the turf is maintained at 2–3 inches. (National Weather Service, 2018). The WS-2 data (precipitation, air and soil temperatures, relative humidity, wind speed, and solar radiation) are stored in a Campbell Scientific data logger housed in a weather-resistant box. The data are recorded every 5 minutes over a 24-hour period from midnight to midnight. The data are electronically transmitted to NMCC, located on NMSU’s main campus in Las Cruces, NM. NMCC weather data are accessible for download at https://weather.nmsu.edu. The weather data summarized in this report are available by request from ASCF via phone at 505-960-7757 (Monday–Friday, except during holiday office closures) or via email at farmingt@nmsu.edu.
SUMMARY
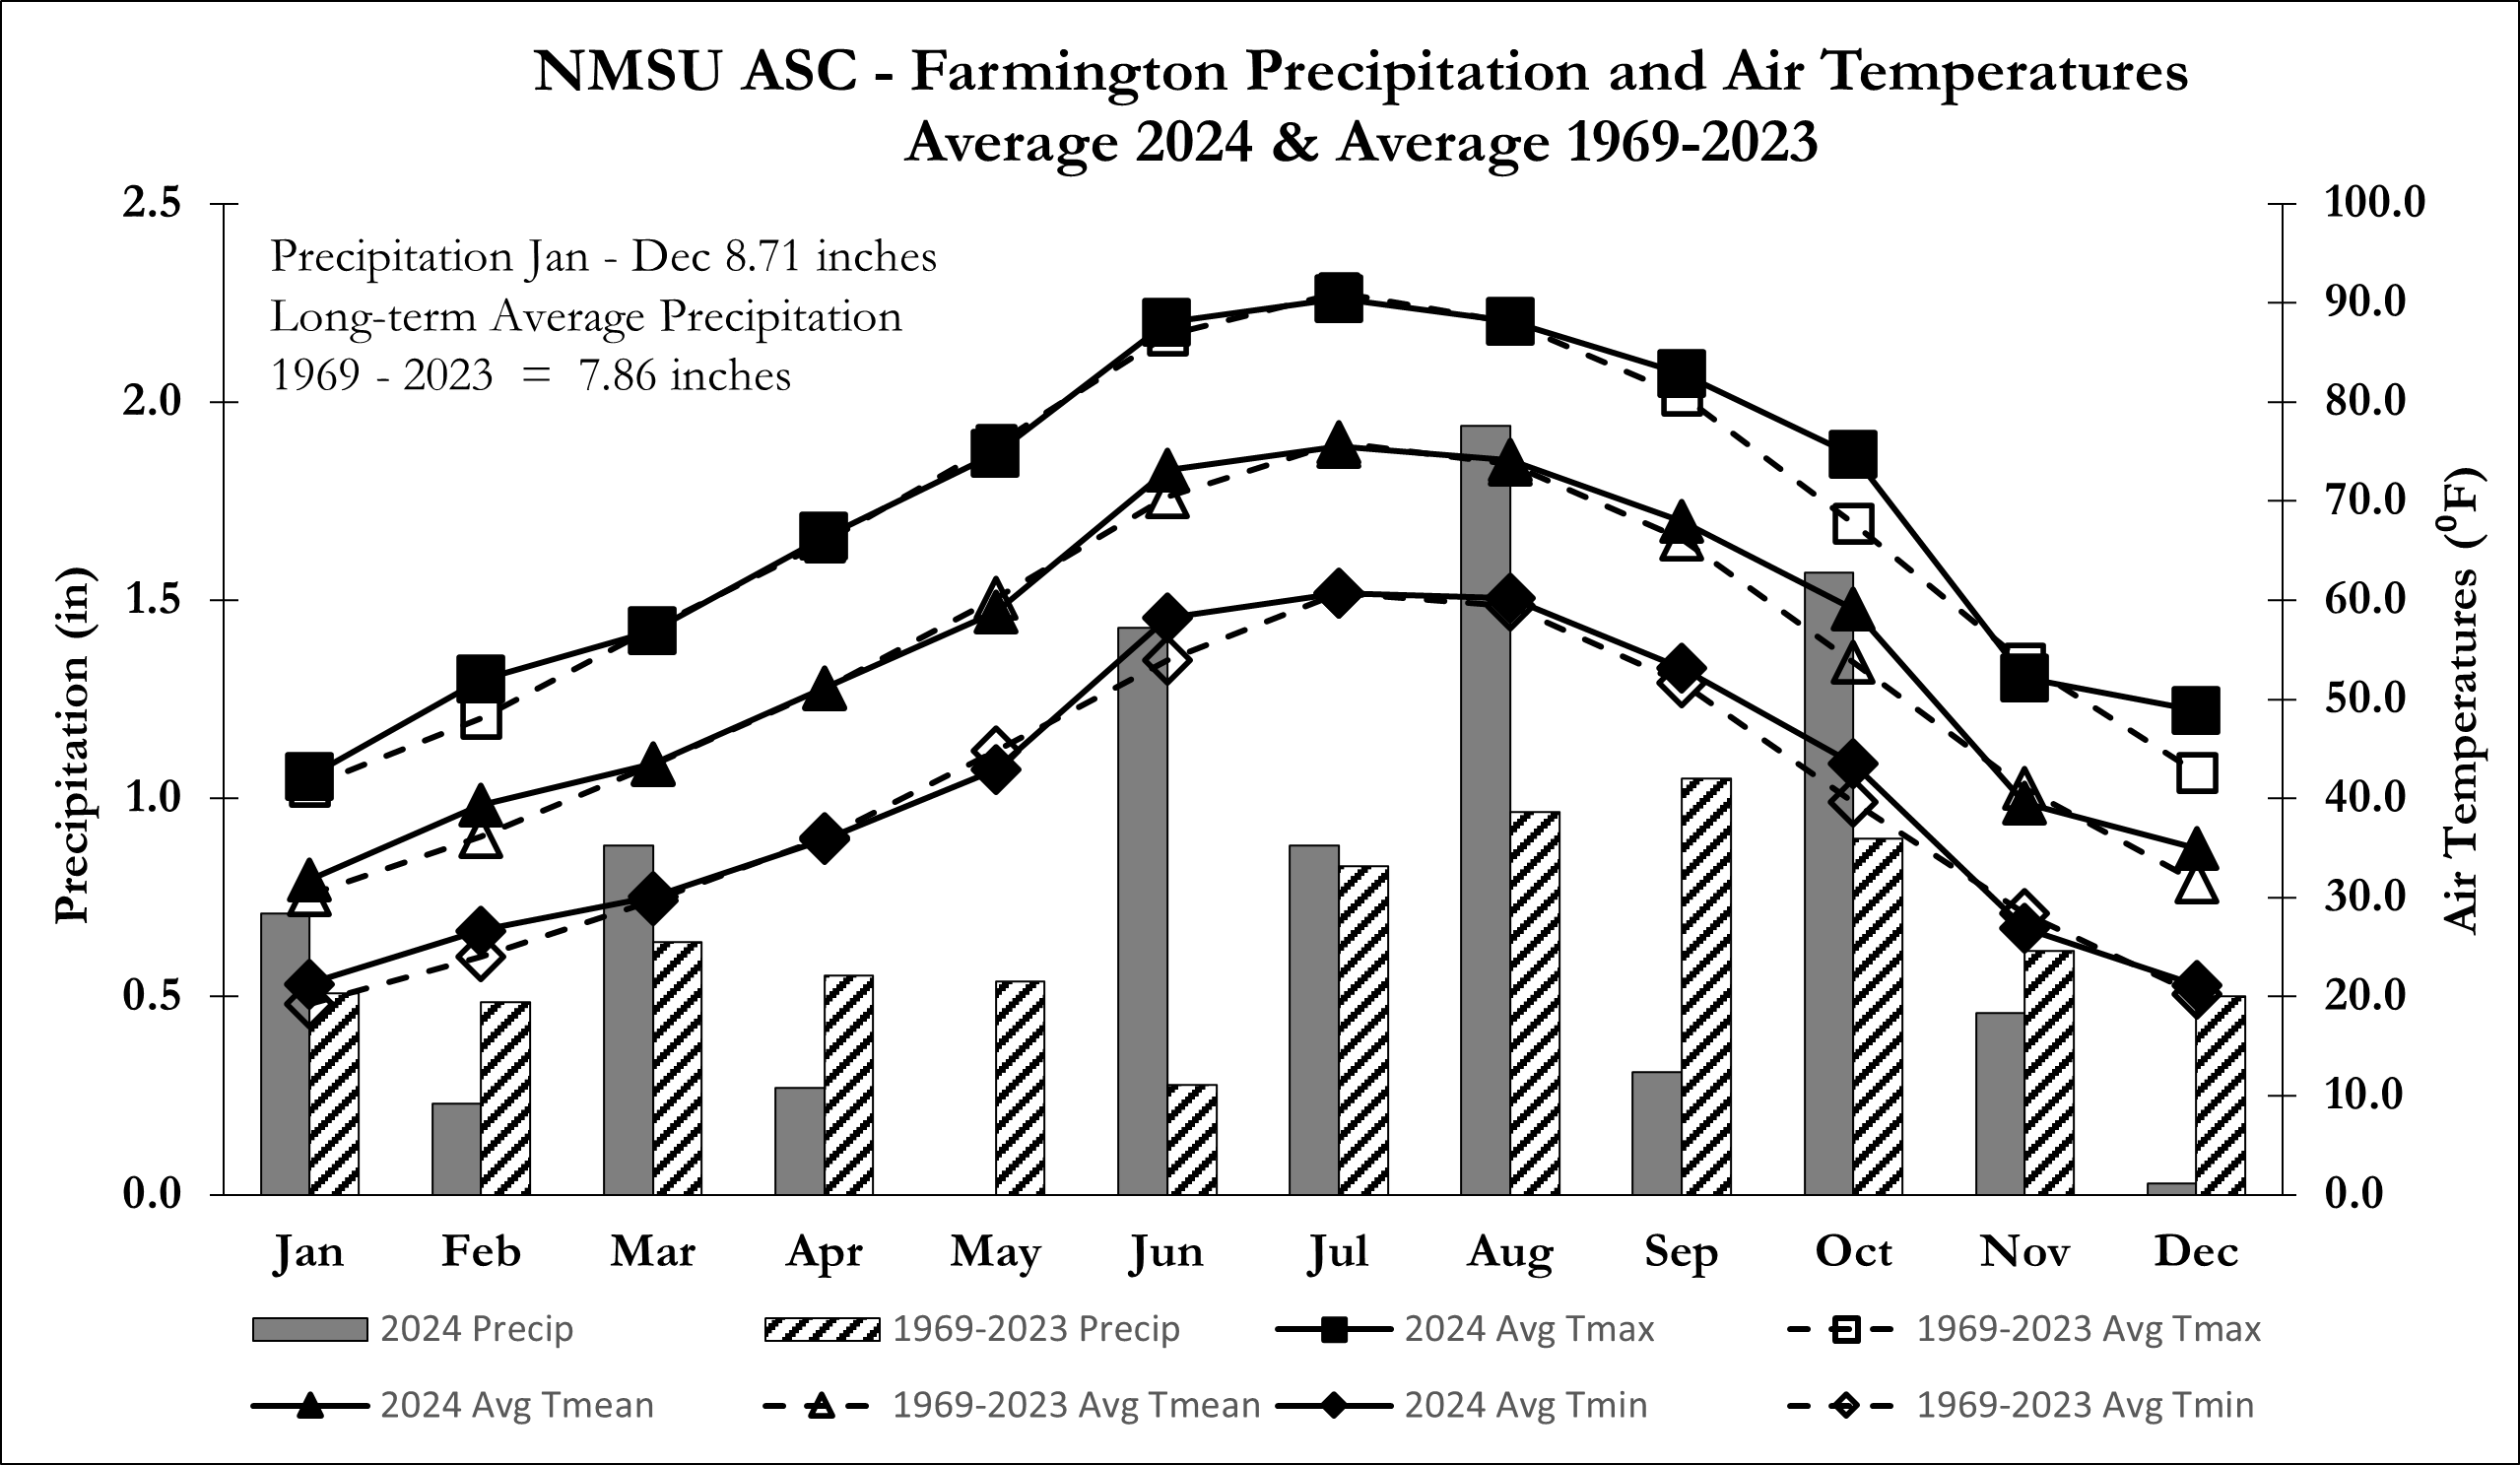
The 2024 summary of climatological data shows an average maximum air temperature of 68°F and an average minimum air temperature of 40°F for the year. The extreme maximum air temperature of 96°F occurred in July and August. The extreme minimum of 1°F occurred in January. The precipitation total for 2024 was 8.71 inches (Table 1). The long-term precipitation average from 1969 through 2024 was 7.87 inches (Figure 1). The 56-year climatological data from 1969 through 2024 shows the annual precipitation average of 7.87 inches and the average maximum and average minimum air temperatures from January through December. The extreme maximum air temperature was 103°F, which occurred in July of 1989, 1990, 2003, and 2005. The extreme minimum air temperature was -18°F, which occurred in January 1971 (Table 2).

-
Figure 1. Monthly Precipitation Total 2024 and Average 1969-2024.
FREEZE DATES
In 2024, there were 157 frost-free days (frost temperature ≤32°F) as compared to the 56-year average of 162. There were 186 killing freeze-free days (killing freeze temperature ≤28°F) in 2024 as compared to the 56-year average of 184 killing freeze-free days (Table 3).
PRECIPITATION
Precipitation is collected from an NWS 8-inch standard rain gauge located at WS-1. The 2024 precipitation total from January to December was 8.71 inches, and the 56-year average annual precipitation from 1969 through 2024 was 7.87 inches. The lowest monthly precipitation recorded for 2024 was in May at 0.00 inches, and the highest was in August at 1.94 inches (Table 4).
AIR TEMPERATURE
Average
The 2024 highest monthly average air temperature of 76°F occurred in July; the 56-year highest monthly mean air temperature of 76°F also occurred in July (Table 5).
Maximum
The 2024 highest average monthly maximum air temperature of 90°F occurred in July, which was lower than the 56-year mean monthly maximum air temperature of 91°F in the month of July (Table 6). The 2024 extreme maximum air temperature of 96°F occurred in July and August. The 56-year extreme maximum air temperature was 103°F and was recorded in July of 1989, 1990, 2003, and 2005 (Table 7).
Minimum
The 2024 lowest average monthly minimum air temperature of 21°F occurred in January and December, which was higher than the 56-year average monthly minimum air temperatures of 19°F and 20°F in January and December, respectively (Table 8). The 2024 extreme minimum air temperature of 1°F occurred in January. The 56-year extreme minimum air temperature of -18°F occurred in January of 1971 (Table 9).
Critical Days
There were 138 days from January through December with temperatures equal to or below 32°F in 2024; the 56-year average was 140 days. There were 0 days with temperatures at or below 0°F during the critical months of January, February, and December in 2024, compared to the 56-year average of 1 day in January and 0 days in February and December (Table 10). In the critical months of May through September in 2024, there were 6 days with temperatures of 95°F or above; in comparison, the 56-year average was 12 days. June and July are critical months for 100°F or above; in 2024, there were a total of 0 days as compared to the 56-year average of 1 day (Table 11).
EVAPORATION
The evaporation rate is measured using a U.S. Weather Bureau no. 252 hook gauge mounted in a NWS Class-A evaporation pan. Evaporation measurements are taken from April 1 through October 31. The 2024 average evaporation for the seven-month data collection period was 0.321 inches as compared to the 50-year average of 0.329 inches (Table 12). The 2024 seven-month total evaporation was 74.83 inches versus the 50-year average of 69.76 inches (Table 13).
WIND RUN
Daily wind speeds are recorded from NWS Nimbus 3-cup anemometers via Nimbus display units. The low wind speed is recorded in miles per day at 6-inch (1980 through March 2019) and 10-inch heights (April 2019 to present) above the evaporation pan rim. The high wind speed is recorded at 79 inches above bare soil. In 2024, May had the highest daily low wind average at 75 miles per day (MPD), while the April monthly average from 1980 through 2024 was 81 MPD (Table 14). The 2024 average daily high wind occurred in the month of May at 101 MPD as compared to the April average of 140 MPD from 1981–2024 (Table 15).
SOLAR RADIATION
Solar radiation data are collected from the NMCC (WS-2) site. The data are stored in a Campbell Scientific data logger that is housed in a protective shelter. The solar radiation is recorded in megajoules per square meter (MJ/m2). Those units are then converted into Langley (ly) units (used in this publication) by using a multiplication factor of 23.89. During 2024, May and July had the highest record Langley units at 588 as compared to the 48-year average for June at 651 (Table 16).
CORN GROWING DEGREE DAYS
Corn growing degree days (GDD) are expressed as heat units using air temperatures required for plant growth and developmental stages. The air temperature threshold for corn GDD in this report was determined by using an upper air temperature parameter of 86°F and lower temperature of 50°F. The peak corn GDD from May through September 2024 was in July at 722 GDD, while the 56-year average for July was 718 GDD (Table 17).
SOIL TEMPERATURE
Soil maximum and minimum temperatures are collected from a National Oceanic and Atmospheric Administration (NOAA) Weather Service soil sensor probe buried 4 inches below the soil surface. This soil equipment is located outside of the WS-1 fenced area. Due to equipment changes since 1977, the soil data (2001–2024) are a continuation of the dataset contained in O’Neill et al. (2018). All prior year soil temperature data are available upon request from ASCF.
Average
The highest average monthly soil temperature from 2001–2024 was in July at 85°F. The extreme maximum average soil temperature was also in July at 99°F. The lowest average minimum soil temperature of 31°F occurred in January. The extreme minimum average soil temperature of 23°F occurred in January (Table 18).
Maximum
The 2024 maximum soil temperature average of 94°F occurred in July. The 24-year (2001–2024) monthly average maximum of 94°F also occurred in July (Table 19). The extreme maximum soil temperature of 106°F occurred in July 2005 (Table 20).
Minimum
The 2024 average minimum soil temperature of 31°F occurred in January. The 24-year (2001–2024) monthly average minimum soil temperature of 29°F also occurred in January (Table 21). The extreme minimum soil temperature of 9°F occurred in January 2013 (Table 22).
ACKNOWLEDGMENTS
Thank you to current and prior NMSU ASCF faculty and staff for their contributions of weather data collection and reporting since 1969. Their efforts contribute to the diligent and long-term weather data collection process at ASCF, an official National Weather Service observation site. Thank you to Stanley Engle, Research Assistant, Sr., NMSU Department of Plant and Environmental Sciences, for his continuous support of the NMCC weather station at ASCF. A thank you to Raymond Jojola and Troy Marshall, hydro-meteorology technicians, National Oceanic and Atmospheric Administration (NOAA) NWS–Albuquerque, for years of maintenance on the ASCF NWS WS-1 equipment.
CONVERSIONS
This table is provided for conversion of English (U.S.) and metric (SI) units for data in this report.
Table for conversions of English (U.S.) and metric (SI) units To Convert English to metric, multiply by English (U.S.) units Metric (SI) units To convert metric to English, multiply by 2.540 inches (in.) centimeters (cm) 0.394 0.305 feet (ft) meters (m) 3.281 1.609 miles (mi) kilometers (km) 0.621 0.093 square feet (ft2) square meters (m2) 10.764 2.590 square miles (mi2) square kilometers (km2) 0.386 0.405 acres (ac) hectares (ha) 2.471 28.350 ounces (oz) grams (g) 0.035 29.574 fluid ounces (fl oz) milliliters (mL) 0.034 3.785 gallons (gal) liters (L) 0.264 0.454 pounds(lb) kilograms (kg) 2.205 907.185 ton (2,000 lb; t) kilograms (kg) 0.001 0.907 ton (2,000 lb; t) metric tons (t) or megagrams (Mg) 1.102 1.000 parts per million (ppm) ppm (mg/kg) 1.000 1.121 pounds/acre (lb/ac) kilograms/hectare (kg/ha) 0.892 2.240 tons/acre (t/ac) megagrams/hectare (Mg/ha) 0.446 16.018 pounds per cubic feet (lb/ft3) kilograms per cubic meter (kg/m3) 0.062 0.070 cubic feet/acre (ft3/ac) cubic meters/hectare (m3/ha) 14.291 73.078 ounces/acre (oz/ac) milliliters/hectare (mL/ha) 0.014 62.710 bushels/acre (corn: 56 lb/bu) kilograms/hectare (kg/ha) 0.016 67.190 bushels/acre (wheat: 60 lb/bu) kilograms/hectare (kg/ha) 0.015 125.535 Cwt/acre (100 wt) kilograms/hectare (kg/ha) 0.008 0.042 Langleys (Ly) Megajoules per square meter (MJ/m2) 23.900 (°F - 32) ÷ 1.8 Fahrenheit (°F) Celsius (°C) (°C × 1.8) + 3 Additional English–metric conversions: https://www.extension.iastate.edu/agdm/wholefarm/html/c6-80.html
REFERENCES
National Weather Service. 2018. Instruction 10-1302: Requirements and standards for NWS climate observations. Silver Spring, MD: Author. https://www.nws.noaa.gov/directives/sym/pd01013002curr.pdf
New Mexico Climate Center. https://weather.nmsu.edu/
New Mexico State University Agricultural Experiment Station, Agricultural Science Center at Farmington. https://farmingtonsc.nmsu.edu/research/weather.html
O’Neill, M.K., D. Smeal, M.M. West, S.C. Allen, and K. Djaman. 2018. Forty-eight years (1969–2016) of climatological data: NMSU Agricultural Science Center at Farmington, New Mexico [Bulletin 809]. Las Cruces: New Mexico State University Agricultural Experiment Station.
Summary 2024
Table 1. Summary of 2024 Climatological Data at the NMSU Agricultural Science Center at Farmington, NM Average Air Temperatures Extreme Air Temperatures Precip-itation Wind Movement Evap-oration Solar Radiation Max. Min. Mean Max. Min. Miles Per Day (MPD) Evaporation Total
Langley's
Average Per DayMonth (⁰F) (⁰F) (⁰F) (⁰F) (⁰F) (in.) 6-10 in. 79 in. (in.) (Ly) Jan 42 21 32 59 1 0.71 39 52 208 Feb 52 27 39 64 13 0.23 54 72 200 Mar 57 30 44 69 20 0.88 53 70 384 Apr 66 36 51 80 20 0.27 69 90 8.64 526 May 74 43 58 88 29 0.00 75 101 11.65 588 Jun 88 58 73 95 50 1.43 54 72 12.46 569 Jul 90 61 76 96 49 0.88 49 63 13.49 588 Aug 88 60 74 96 51 1.94 45 58 11.13 477 Sep 83 53 68 88 43 0.31 49 55 10.30 455 Oct 75 44 59 88 25 1.57 36 47 7.16 339 Nov 52 27 39 67 12 0.46 37 46 239 Dec 49 21 35 62 13 0.03 32 37 220 Mean 68 40 54 79 27 0.73 49 64 399 Total 8.71 74.83 Summary Fifty-six Years (1969-2024)
Table 2. Summary of Fifty-six Years (1969-2024) Average Monthly Climatological Data at the NMSU Agricultural Science Center at Farmington, NM
Average Air Temperature
Extreme Air Temperature Month Precipitation
(in.)Maximum
(⁰F)Minimum
(⁰F)Maximum
(⁰F)Year(s)
RecordedMinimum
(⁰F)Year(s)
RecordedJan 0.51 41 19 66 2000 -18 1971 Feb 0.48 48 24 70 1986 -14 1989 Mar 0.64 57 30 82 2004 3 2002 Apr 0.55 66 36 86 1992 14 2023 May 0.53 76 45 97 2000 23 1975 Jun 0.30 87 54 101 2016 32 1999 Jul 0.83 91 61 103 1989,1990, 2003, 2005 43 1969, 2020 Aug 0.98 88 59 99 1969, 1970, 1983, 2002 41 1980 Sep 1.04 81 52 97 1995 28 1971, 1999 Oct 0.91 68 40 88 2010, 2015 5 2019 Nov 0.61 54 28 75 1999, 2001, 2020 1 1976 Dec 0.49 43 20 67 1999 -16 1990 Average 7.87 Freeze Dates
Table 3. Freeze Dates and Number of Consecutive Freeze-free Days at NMSU Agricultural Science Center at Farmington, NM, 1969-2024 Less than or equal to 32ºF Less than or equal to 28ºF Last Spring
FrostFirst Fall
FrostFrost-free
PeriodLast Spring
Killing FreezeFirst Fall
Killing FreezeKilling Freeze-free
PeriodYear date date days date date days 1969 27-Apr 5-Oct 161 26-Apr 6-Oct 163 1970 2-May 8-Oct 159 1-May 9-Oct 161 1971 9-May 18-Sep 132 27-Apr 18-Sep 144 1972 2-May 30-Oct 181 27-Apr 31-Oct 187 1973 2-May 11-Oct 162 2-May 27-Oct 178 1974 21-May 30-Oct 162 20-May 4-Nov 168 1975 8-May 14-Oct 159 7-May 14-Oct 160 1976 27-Apr 7-Oct 164 27-Apr 19-Oct 175 1977 21-Apr 31-Oct 193 5-Apr 2-Nov 211 1978 6-May 26-Oct 173 6-May 13-Nov 191 1979 12-May 21-Oct 162 20-Apr 22-Oct 185 1980 26-May 16-Oct 143 25-May 17-Oct 145 1981 9-May 16-Oct 160 5-Apr 17-Oct 194 1982 6-May 6-Oct 153 21-Apr 10-Oct 172 1983 19-May 21-Sep 125 17-May 9-Nov 176 1984 8-May 15-Oct 160 8-May 16-Oct 161 1985 14-May 30-Sep 139 1-Apr 1-Nov 214 1986 27-Apr 12-Oct 168 27-Apr 13-Oct 169 1987 21-Apr 19-Oct 181 21-Apr 11-Nov 204 1988 7-May 12-Nov 189 11-Apr 16-Nov 219 1989 30-Apr 18-Oct 171 21-Mar 27-Oct 219 1990 10-Apr 9-Oct 181 31-Mar 21-Oct 204 1991 5-May 28-Oct 176 29-Apr 29-Oct 182 1992 21-Apr 8-Oct 170 19-Mar 8-Oct 203 1993 9-May 19-Oct 163 20-Apr 27-Oct 190 1994 30-Apr 17-Oct 170 8-Apr 31-Oct 206 1995 25-Apr 6-Oct 164 18-Apr 6-Oct 171 1996 30-Apr 19-Sep 142 29-Apr 18-Oct 172 1997 2-May 13-Oct 163 2-May 13-Oct 163 1998 15-May 6-Oct 144 19-Apr 6-Oct 170 1999 5-Jun 28-Sep 115 16-Apr 29-Sep 166 2000 12-May 14-Oct 154 3-Apr 2-Nov 212 2001 23-Apr 11-Oct 170 13-Apr 11-Oct 180 2002 22-Apr 4-Oct 165 22-Apr 4-Nov 196 2003 11-May 27-Oct 168 8-Apr 27-Oct 201 2004 1-May 23-Oct 174 29-Mar 30-Oct 214 2005 22-Apr 31-Oct 192 21-Apr 15-Nov 207 2006 20-Apr 23-Sep 155 19-Apr 22-Oct 183 2007 7-May 7-Oct 153 19-Apr 7-Oct 171 2008 3-May 12-Oct 162 2-May 12-Oct 163 2009 27-Apr 22-Sep 147 16-Apr 2-Oct 168 2010 12-May 26-Oct 166 12-May 26-Oct 166 2011 3-May 8-Oct 157 2-May 28-Oct 178 2012 16-Apr 25-Oct 192 16-Apr 25-Oct 192 2013 3-May 5-Oct 154 3-May 17-Oct 166 2014 13-May 3-Nov 172 1-May 4-Nov 186 2015 10-May 28-Oct 170 17-Apr 6-Nov 202 2016 26-Apr 20-Oct 176 3-Apr 18-Nov 227 2017 19-May 25-Sep 130 10-Apr 15-Oct 189 2018 19-Apr 15-Oct 178 18-Apr 15-Oct 179 2019 21-May 11-Oct 143 12-Apr 11-Oct 182 2020 17-Apr 29-Sep 162 29-Mar 26-Oct 181 2021 24-May 13-Oct 142 19-Apr 15-Oct 180 2022 5-May 24-Oct 171 25-Apr 25-Oct 182 2023 29-Apr 13-Oct 166 21-Apr 13-Oct 174 2024 6-May 11-Oct 157 7-Apr 11-Oct 186 Mean 4-May 13-Oct 162 20-Apr 21-Oct 184 Precipitation
Table 4. Average Monthly Precipitation in Inches at the Agricultural Science Center at Farmington, NM, 1969-2024 Year Jan Feb Mar Apr May Jun Jul Aug Sep Oct Nov Dec Total 1969 0.85 0.31 0.21 0.30 1.13 1.00 0.69 0.47 2.07 2.88 0.38 0.29 10.58 1970 0.06 0.03 0.49 0.60 0.11 0.81 0.68 0.02 2.48 0.48 0.46 0.20 6.42 1971 0.18 0.09 0.05 0.11 0.41 0.00 0.31 1.72 1.06 1.15 0.77 0.16 6.01 1972 0.03 0.00 0.03 0.00 0.02 0.18 0.04 1.34 0.57 3.53 0.19 0.93 6.86 1973 0.28 0.17 1.82 1.54 0.65 0.95 0.27 0.61 1.49 0.35 0.30 0.37 8.80 1974 1.10 0.13 0.01 0.20 0.02 0.09 1.48 0.12 0.37 2.39 0.48 0.38 6.77 1975 0.11 0.61 1.52 0.78 0.35 0.13 0.84 0.24 0.80 0.14 0.22 0.20 5.94 1976 0.06 0.16 0.00 0.10 0.41 0.09 0.62 0.80 1.31 0.01 0.01 0.00 3.57 1977 0.42 0.00 0.00 0.01 0.29 0.04 1.01 1.41 0.38 0.30 0.62 0.63 5.11 1978 0.90 0.64 1.27 0.71 0.96 0.00 0.07 0.18 1.55 1.46 2.24 0.59 10.57 1979 0.88 0.19 0.46 0.28 0.58 0.43 1.40 0.49 0.08 1.37 0.97 0.73 7.86 1980 1.45 0.70 0.63 0.25 0.25 0.07 0.08 0.89 1.05 0.84 0.02 0.00 6.23 1981 0.00 0.30 1.76 0.21 1.05 0.16 1.34 0.35 0.69 0.89 0.36 0.03 7.14 1982 0.32 0.77 1.18 0.67 0.82 0.00 1.27 2.78 1.50 0.16 0.92 0.76 11.15 1983 0.94 0.69 1.84 0.31 0.13 0.35 1.67 0.72 0.53 0.52 0.91 0.67 9.28 1984 0.00 0.12 0.54 1.00 0.00 0.67 0.62 1.64 0.45 1.13 0.23 0.87 7.27 1985 0.39 0.13 1.74 1.76 0.29 0.01 1.38 0.43 1.31 1.21 0.52 0.22 9.39 1986 0.11 0.77 0.51 0.97 0.13 0.81 4.10 0.93 2.18 0.65 2.73 0.76 14.65 1987 0.10 1.75 0.66 0.00 0.68 0.02 0.28 1.17 0.27 1.07 1.65 0.59 8.24 1988 0.63 0.82 0.02 0.72 1.11 0.33 0.58 2.34 0.27 0.22 0.78 0.19 8.01 1989 1.19 0.56 0.06 0.00 0.00 0.00 1.24 1.62 0.14 0.51 0.00 0.00 5.32 1990 0.53 0.53 0.74 0.85 1.07 0.07 1.35 1.32 1.97 1.12 0.78 0.59 9.92 1991 0.59 0.26 0.67 0.01 0.27 0.69 0.35 0.58 1.38 0.38 2.07 1.01 8.26 1992 0.15 0.18 0.74 0.25 1.75 0.05 0.98 1.25 0.85 0.42 0.31 0.63 7.56 1993 2.05 0.82 0.93 0.28 0.38 0.04 0.03 2.06 0.84 1.25 0.47 0.15 9.30 1994 0.09 0.48 0.24 0.57 1.32 0.07 0.20 0.66 1.37 1.18 0.96 0.64 7.78 1995 0.57 0.14 1.45 1.28 0.90 0.03 0.23 1.88 2.04 0.10 0.14 0.39 9.15 1996 0.09 0.43 0.28 0.17 0.00 0.64 0.24 1.07 0.63 2.21 0.72 0.22 6.70 1997 1.03 0.48 0.03 2.88 0.82 0.62 1.28 1.12 2.68 0.43 0.67 0.80 12.84 1998 0.12 0.61 0.65 0.73 0.03 0.02 1.38 1.48 0.68 2.07 1.27 0.06 9.10 1999 0.14 0.05 0.13 1.21 1.26 0.44 2.51 2.99 0.25 0.01 0.06 0.12 9.17 2000 0.62 0.25 2.05 0.21 0.03 0.12 0.80 1.22 0.50 2.16 0.78 0.22 8.96 2001 0.44 0.80 1.37 0.67 0.87 0.03 0.82 1.01 0.26 0.24 0.48 0.55 7.54 2002 0.04 0.04 0.17 0.37 0.00 0.00 0.42 0.32 3.26 1.75 0.72 0.60 7.69 2003 0.08 1.29 0.49 0.02 0.01 0.15 0.11 1.24 0.87 0.72 1.03 0.31 6.32 2004 0.34 0.90 0.00 2.50 0.00 0.14 0.38 0.16 2.53 0.60 0.82 0.37 8.74 2005 1.09 1.81 0.36 0.85 0.55 0.11 0.52 1.84 0.48 0.92 0.06 0.10 8.69 2006 0.39 0.05 0.71 0.58 0.09 0.24 1.90 0.79 1.38 1.90 0.06 0.73 8.82 2007 0.42 0.59 1.13 0.35 1.73 0.10 0.68 0.81 0.74 0.11 0.21 0.99 7.86 2008 1.21 0.74 0.14 0.03 0.25 0.13 0.63 0.53 0.28 0.76 0.61 0.96 6.27 2009 0.36 0.44 0.21 0.28 0.78 0.47 0.15 0.27 0.09 0.68 0.32 0.42 4.47 2010 1.34 0.95 0.82 0.26 0.10 0.10 0.65 2.50 0.84 1.32 0.12 0.78 9.78 2011 0.03 0.18 0.34 1.09 0.86 0.01 0.65 0.05 1.02 1.86 0.55 0.30 6.94 2012 0.10 0.40 0.20 0.01 0.08 0.01 1.07 0.15 0.67 0.08 0.24 0.69 3.70 2013 0.88 0.07 0.14 0.49 0.26 0.00 0.54 1.34 3.29 0.66 0.91 0.14 8.72 2014 0.00 0.41 0.88 0.13 0.26 0.00 0.47 1.07 1.55 0.15 0.31 0.88 6.11 2015 1.22 0.93 0.31 0.61 1.70 1.80 0.91 1.14 0.51 1.10 0.89 0.65 11.77 2016 0.46 0.34 0.01 0.80 0.93 0.00 0.47 1.37 1.05 0.28 1.50 0.97 8.18 2017 0.71 0.91 0.29 1.63 1.14 0.02 2.51 0.11 1.57 0.08 0.14 0.00 9.11 2018 0.25 0.09 0.09 0.20 0.32 0.80 0.60 0.21 0.14 0.81 0.06 1.40 4.97 2019 0.56 0.99 1.32 0.31 1.93 0.29 0.31 0.07 0.53 0.16 0.75 0.87 8.09 2020 0.58 0.21 0.65 0.01 0.03 0.15 1.24 0.02 0.46 0.29 0.16 0.19 3.99 2021 0.50 0.44 0.93 0.08 0.07 0.29 0.35 0.68 0.77 0.85 0.11 0.92 5.99 2022 0.06 0.37 0.50 0.15 0.00 1.10 1.81 1.08 1.35 1.47 0.47 0.76 9.12 2023 0.86 0.60 1.24 0.05 0.37 0.39 0.03 0.47 0.40 0.03 0.33 0.54 5.31 2024 0.71 0.23 0.88 0.27 0.00 1.43 0.88 1.94 0.31 1.57 0.46 0.03 8.71 Mean 0.51 0.48 0.64 0.55 0.53 0.30 0.83 0.98 1.04 0.91 0.61 0.49 7.87 Air Temperature
Table 5. Average* Monthly Air Temperature in ⁰F at the NMSU Agricultural Science Center at Farmington, NM, 1969-2024 Year Jan Feb Mar Apr May Jun Jul Aug Sep Oct Nov Dec 1969 34 35 37 52 63 67 76 76 69 50 40 34 1970 31 40 39 44 60 68 76 76 64 50 42 33 1971 30 34 43 50 58 71 77 74 64 52 40 30 1972 30 38 48 53 60 70 78 74 66 54 36 26 1973 22 35 39 45 59 68 75 75 63 55 44 30 1974 24 28 48 48 63 74 75 74 65 55 40 28 1975 26 34 40 46 56 66 74 72 64 54 38 30 1976 28 41 40 52 60 70 77 74 66 51 40 32 1977 25 37 39 54 59 74 76 75 68 56 43 36 1978 33 34 46 52 56 69 76 71 65 56 42 24 1979 24 32 40 50 58 67 74 72 69 56 35 32 1980 33 39 40 48 57 71 76 73 65 52 41 37 1981 30 37 41 55 59 71 74 72 65 51 44 34 1982 30 31 42 49 57 67 73 72 65 50 40 32 1983 31 36 42 45 56 66 74 75 68 54 41 34 1984 28 34 41 47 64 69 76 74 66 47 42 35 1985 30 32 41 53 61 71 76 74 62 54 40 31 1986 40 39 47 51 60 70 72 74 62 52 40 33 1987 29 36 39 53 59 70 73 71 65 56 39 29 1988 24 36 41 51 59 72 76 74 64 58 41 31 1989 27 35 49 57 63 70 78 72 69 55 41 31 1990 29 36 46 54 59 75 76 73 69 54 42 24 1991 25 37 41 49 59 68 75 74 66 56 38 29 1992 28 39 45 56 62 68 72 73 66 56 35 26 1993 35 38 44 51 61 69 74 71 64 52 38 32 1994 33 35 46 52 61 73 77 76 66 53 38 35 1995 33 44 44 48 57 67 74 76 67 53 44 35 1996 32 41 43 51 64 71 76 73 61 52 40 32 1997 29 36 46 47 61 70 74 73 68 52 41 31 1998 34 35 42 48 61 67 77 74 70 54 42 32 1999 35 39 48 49 58 68 74 71 63 54 45 30 2000 34 40 42 53 63 71 75 75 68 54 35 34 2001 31 37 45 54 63 71 77 74 70 57 45 31 2002 32 34 42 57 63 75 78 74 66 53 40 32 2003 38 36 44 51 63 71 81 77 66 59 41 34 2004 30 34 50 53 64 72 75 73 65 54 41 33 2005 38 40 43 52 62 69 79 73 68 56 43 32 2006 34 37 43 55 65 74 78 73 62 52 44 31 2007 28 37 47 52 61 72 78 76 68 55 44 30 2008 24 33 42 50 58 70 75 74 66 54 44 31 2009 32 38 45 49 64 68 77 73 67 50 43 27 2010 26 33 41 51 57 72 76 72 67 56 39 38 2011 24 32 45 50 56 71 77 76 65 53 40 30 2012 32 35 45 55 63 74 76 75 67 55 44 32 2013 24 32 44 50 60 73 77 73 67 50 41 28 2014 32 39 44 50 59 71 77 72 69 56 42 34 2015 33 40 47 51 57 72 74 74 68 59 41 30 2016 29 38 46 51 59 76 76 72 65 58 45 34 2017 33 42 49 50 58 73 77 73 67 55 48 35 2018 35 39 44 55 64 74 80 76 69 53 37 32 2019 30 33 47 55 55 67 74 75 68 48 40 32 2020 30 34 43 50 62 70 74 76 65 54 44 27 2021 30 35 41 52 61 73 77 73 66 52 44 34 2022 32 34 42 52 61 71 76 74 70 53 36 34 2023 32 33 39 49 61 66 77 74 67 55 43 34 2024 32 39 44 51 58 73 76 74 68 59 39 35 Mean 30 36 43 51 60 70 76 74 66 54 41 32 *The average temperature represents the sum of the average daily temperature ([maximum + minimum]/2) in each month.
Table 6. Average* Monthly Maximum Air Temperature in ⁰F at the NMSU Agricultural Science Center at Farmington, NM, 1969-2024 Year Jan Feb Mar Apr May Jun Jul Aug Sep Oct Nov Dec 1969 42 46 50 69 78 81 91 90 83 62 51 45 1970 42 54 52 60 78 84 91 91 78 63 55 44 1971 43 48 59 66 74 87 93 87 80 65 51 39 1972 43 54 66 70 78 86 93 87 80 63 46 37 1973 32 42 50 59 74 84 90 90 79 70 57 42 1974 34 40 62 64 80 91 89 88 80 66 52 39 1975 37 44 52 60 71 85 89 88 79 70 53 42 1976 41 54 56 68 76 87 92 88 79 65 53 45 1977 34 51 53 69 74 90 90 89 81 71 54 47 1978 41 44 58 65 70 85 90 86 78 70 51 33 1979 31 42 52 65 72 84 90 86 84 71 46 43 1980 41 50 53 64 72 89 93 88 80 66 55 51 1981 49 51 53 70 74 88 90 88 80 65 58 46 1982 41 41 54 63 72 84 89 85 78 65 51 41 1983 40 46 53 59 72 82 90 89 83 68 52 43 1984 41 48 56 61 80 84 91 87 80 60 55 45 1985 41 44 55 67 75 88 91 89 76 67 51 43 1986 49 51 61 64 75 84 86 89 75 65 50 44 1987 40 47 52 68 74 87 90 86 80 71 51 40 1988 35 47 57 65 75 87 92 87 80 73 53 43 1989 38 45 63 73 79 86 93 87 84 69 56 45 1990 41 47 58 67 73 90 90 87 82 68 54 36 1991 35 49 53 65 75 84 90 88 80 71 49 37 1992 38 50 58 71 76 84 86 87 81 72 48 36 1992 38 50 58 71 76 84 86 87 81 72 48 36 1993 44 48 59 67 76 86 91 85 79 66 50 43 1994 46 46 61 66 76 90 93 91 81 66 50 46 1995 42 58 58 61 71 83 91 90 81 69 59 47 1996 45 54 58 68 82 87 91 89 76 66 53 43 1997 39 48 63 61 77 86 90 87 82 67 54 42 1998 45 46 57 62 78 85 92 90 86 68 56 45 1999 50 54 64 63 73 86 89 84 80 73 63 44 2000 47 53 56 68 82 89 93 91 84 66 46 45 2001 41 48 57 68 79 89 92 88 85 72 59 43 2002 45 49 57 72 79 93 94 90 80 66 53 43 2003 51 48 56 67 79 88 97 91 82 74 52 46 2004 41 45 65 66 80 89 91 88 79 67 51 44 2005 48 49 56 67 78 86 96 88 83 69 57 45 2006 46 52 56 70 82 91 92 86 75 64 57 42 2007 38 48 61 66 74 88 93 90 82 69 59 39 2008 34 43 58 66 74 85 90 88 80 69 56 40 2009 42 51 59 64 78 81 92 88 80 63 55 37 2010 35 42 54 65 73 88 90 85 82 69 52 47 2011 35 44 59 64 71 87 92 90 79 66 51 40 2012 45 46 60 70 79 90 90 89 81 70 58 42 2013 35 43 59 65 75 90 90 87 79 64 52 38 2014 46 52 58 65 74 87 92 86 83 69 55 43 2015 42 52 61 66 70 86 87 88 83 71 53 41 2016 38 52 61 65 73 92 91 84 79 72 56 43 2017 41 52 64 65 73 91 92 87 81 70 62 49 2018 47 52 58 70 80 90 93 90 84 65 51 42 2019 39 44 58 68 68 84 90 89 82 65 55 43 2020 40 46 55 65 80 87 89 92 82 72 59 42 2021 43 48 54 68 78 89 91 88 82 66 59 46 2022 46 48 57 67 77 86 89 86 84 67 50 46 2023 42 46 51 64 76 82 93 88 81 71 56 46 2024 42 52 57 66 74 88 90 88 83 75 52 49 Mean 41 48 57 66 76 87 91 88 81 68 54 43 *The average monthly maximum temperature represents the sum of the maximum daily temperatures in each month divided by the number of days in that month.
Table 7. Extreme Maximum Air Temperature in ⁰F at the Agricultural Science Center at Farmington, NM, 1969-2024 Year Jan Feb Mar Apr May Jun Jul Aug Sep Oct Nov Dec 1969 57 61 74 82 89 96 96 99 95 78 63 56 1970 56 65 65 72 86 98 98 99 90 76 64 61 1971 60 64 77 77 84 97 101 91 90 67 70 57 1972 61 66 76 78 86 94 100 98 89 82 57 52 1973 47 61 63 76 85 98 99 97 88 81 73 65 1974 45 60 72 75 93 99 95 94 93 83 64 56 1975 61 58 65 77 85 96 95 95 89 84 73 57 1976 54 68 71 77 86 96 100 93 94 78 70 55 1977 46 65 69 81 91 98 97 98 93 82 74 63 1978 53 59 79 77 88 95 95 94 90 83 67 47 1979 46 60 62 78 82 96 97 96 94 83 60 54 1980 55 64 67 81 86 99 97 97 88 84 73 63 1981 60 67 71 82 84 100 97 96 85 78 68 56 1982 60 64 64 75 75 93 97 95 91 79 64 53 1983 53 68 68 83 89 92 96 99 93 74 70 50 1984 51 60 68 79 93 94 95 93 89 75 68 54 1985 50 60 70 79 85 95 100 95 93 75 68 51 1986 64 70 75 79 85 94 96 96 88 75 63 55 1987 56 61 69 80 82 93 98 93 89 83 66 58 1988 49 62 77 78 87 99 96 93 93 83 70 56 1989 50 67 81 85 90 98 103 92 91 85 67 53 1990 56 64 74 80 86 100 103 94 93 79 69 55 1991 44 58 67 79 85 94 97 93 91 82 67 46 1992 52 58 67 86 85 92 95 95 89 83 61 49 1993 54 61 72 81 86 96 96 96 88 84 61 56 1994 58 63 74 81 90 100 98 97 89 80 70 55 1995 53 68 74 77 82 92 101 97 97 83 68 64 1996 56 65 71 82 90 93 96 96 90 83 66 57 1997 58 60 75 76 88 93 98 92 91 84 68 54 1998 56 62 77 80 87 99 100 95 90 85 67 60 1999 62 65 75 78 85 94 99 91 89 85 75 67 2000 66 66 70 85 97 94 97 97 93 83 57 55 2001 51 62 70 81 90 96 99 94 93 86 75 59 2002 59 63 74 81 95 98 100 99 90 77 63 55 2003 57 59 74 78 95 96 103 98 92 87 67 62 2004 51 62 82 78 89 96 99 97 91 78 67 60 2005 57 57 68 80 94 98 103 95 89 83 74 59 2006 57 62 71 85 92 99 100 92 87 83 69 54 2007 56 64 76 81 85 95 98 96 89 80 71 53 2008 51 54 70 79 89 93 94 97 87 81 74 53 2009 53 69 73 78 88 92 96 96 88 77 72 49 2010 44 50 75 78 90 98 98 94 89 88 71 59 2011 50 63 72 79 87 96 97 95 89 81 68 57 2012 53 59 73 85 87 98 97 95 90 83 70 60 2013 54 58 74 80 87 99 97 93 91 77 68 55 2014 60 66 69 78 91 94 97 92 91 77 74 59 2015 58 66 76 78 81 98 97 94 88 88 71 57 2016 55 66 73 82 85 101 97 94 88 79 70 56 2017 52 64 80 80 86 100 99 93 95 84 73 63 2018 62 62 73 80 89 96 98 96 90 81 60 56 2019 51 58 73 80 82 92 96 95 94 81 68 53 2020 52 56 65 81 91 94 96 96 94 81 75 55 2021 56 60 70 79 87 100 101 93 93 78 74 57 2022 57 62 78 80 88 96 97 92 96 79 67 59 2023 57 61 70 80 83 92 99 93 92 85 74 59 2024 59 64 69 80 88 95 96 96 88 88 67 62 Mean 55 62 72 80 87 96 98 95 91 81 68 56 Maximum 66 70 82 86 97 101 103 99 97 88 75 67 Year(s)
Recorded2000 1986 2004 1992 2000 2016 1989
1990
2003
20051969
1970
1983
20021995 2010
20151999
2001
20201999
Table 8. Average* Monthly Minimum Air Temperature in ⁰F at the NMSU Agricultural Science Center at Farmington, NM, 1969-2024 Year Jan Feb Mar Apr May Jun Jul Aug Sep Oct Nov Dec 1969 25 24 24 35 48 51 61 62 55 39 30 22 1970 20 27 26 29 43 53 62 62 49 36 30 22 1971 16 20 26 33 42 54 61 60 48 38 28 21 1972 18 22 31 36 43 55 62 60 53 45 27 15 1973 12 26 29 32 44 52 60 60 48 40 31 19 1974 14 17 33 33 46 57 61 59 50 44 28 17 1975 14 23 28 31 40 48 60 57 50 39 24 19 1976 16 28 25 36 45 53 62 59 54 37 26 17 1977 15 22 25 39 44 59 62 61 55 42 31 26 1978 25 25 33 38 43 53 61 57 52 43 33 15 1979 16 22 28 34 44 50 58 57 53 40 25 20 1980 26 28 27 33 41 52 59 58 50 35 27 24 1981 20 23 29 39 44 54 58 56 50 37 30 22 1982 18 21 30 34 43 51 58 60 52 35 29 22 1983 21 26 31 31 41 51 58 61 52 41 29 24 1984 16 20 27 33 48 53 61 60 52 36 30 25 1985 20 19 32 38 46 54 61 59 48 41 29 19 1986 23 26 33 39 44 55 59 60 50 40 29 22 1987 18 25 26 39 45 53 57 57 49 40 28 19 1988 13 24 25 36 44 56 61 60 48 43 29 19 1989 16 24 34 40 47 54 63 58 54 40 26 16 1990 18 25 35 41 45 59 63 60 56 40 30 11 1991 16 25 30 34 44 53 59 59 51 40 27 21 1992 18 27 32 40 48 52 57 58 50 40 22 16 1993 26 28 30 36 45 52 57 58 48 38 25 20 1994 19 24 31 38 46 56 60 61 50 39 27 24 1995 24 29 31 35 43 50 58 61 52 37 29 23 1996 19 28 29 34 47 54 60 58 47 38 28 21 1997 19 24 28 32 46 54 59 59 54 37 28 20 1998 22 25 28 33 45 48 62 59 54 40 29 19 1999 21 24 31 34 43 50 59 57 46 36 28 15 2000 22 28 29 37 44 54 58 58 52 42 25 23 2001 21 26 32 40 47 54 63 59 54 42 32 19 2002 19 18 26 41 46 57 61 58 51 39 27 22 2003 25 24 31 35 47 53 64 62 50 44 29 22 2004 19 22 35 39 47 55 59 58 51 41 30 21 2005 28 31 30 37 47 52 62 59 54 43 29 19 2006 21 21 31 39 48 57 64 60 48 40 31 20 2007 17 26 32 38 48 56 62 62 53 40 28 20 2008 13 24 27 34 42 54 61 60 51 40 32 22 2009 22 25 31 34 49 54 62 58 53 36 30 16 2010 17 24 28 37 42 55 62 59 53 43 26 28 2011 14 19 31 36 42 55 61 62 52 39 29 20 2012 19 23 30 39 47 58 62 61 53 40 30 21 2013 13 20 29 36 45 56 63 60 55 36 29 17 2014 18 26 30 35 45 54 63 59 56 43 28 25 2015 24 27 34 36 45 57 60 60 54 46 28 19 2016 19 24 30 38 44 60 61 59 51 44 34 24 2017 24 31 34 36 44 56 63 60 52 39 33 21 2018 23 25 29 40 47 58 66 62 54 41 24 22 2019 21 23 35 41 42 51 59 60 53 31 24 21 2020 20 21 31 35 44 53 59 60 48 35 29 13 2021 17 21 27 36 44 57 63 57 51 39 29 22 2022 17 19 28 37 45 56 63 61 57 39 23 21 2023 23 20 27 33 45 50 61 60 52 39 29 23 2024 21 27 30 36 43 58 61 60 53 44 27 21 Mean 19 24 30 36 45 54 61 59 52 40 28 20 *The average monthly minimum air temperature represents the sum of the minimum daily temperatures in each month divided by the number of days in that month.
Table 9. Extreme Minimum Air Temperature in ⁰F at the NMSU Agricultural Science Center at Farmington, NM, 1969-2024 Year Jan Feb Mar Apr May Jun Jul Aug Sep Oct Nov Dec 1969 09 12 13 27 37 44 43 52 46 26 14 07 1970 00 15 11 20 27 39 53 54 34 21 18 14 1971 -18 05 06 17 31 38 54 54 28 18 17 04 1972 02 02 14 24 30 47 56 54 37 22 15 02 1973 01 10 20 18 28 41 52 49 37 26 14 09 1974 -11 01 20 18 28 38 53 52 33 30 14 01 1975 -2 9 9 19 23 38 55 49 40 20 07 06 1976 -4 12 11 23 34 38 54 52 42 22 01 09 1977 -2 13 12 21 33 51 57 54 46 32 20 10 1978 12 00 20 26 31 45 51 46 32 31 18 -9 1979 -8 05 17 16 29 36 51 51 42 23 06 09 1980 14 18 13 18 27 36 53 41 37 17 12 11 1981 10 11 21 19 32 36 44 49 42 21 13 04 1982 -1 -3 19 22 30 38 47 54 38 21 17 06 1983 09 20 22 20 27 36 61 55 30 35 11 10 1984 02 11 14 18 27 40 53 54 39 23 15 13 1985 06 -1 13 28 29 39 53 51 31 31 08 08 1986 08 08 19 23 33 42 53 52 40 28 16 08 1987 02 08 09 24 35 43 50 47 40 32 14 01 1988 -2 16 09 21 30 38 54 54 33 36 12 01 1989 04 -14 14 29 36 41 55 48 36 15 09 03 1990 00 04 19 30 39 47 55 52 45 26 16 -16 1991 -3 12 17 24 30 39 53 54 39 20 11 03 1992 10 17 20 30 40 41 47 48 37 28 07 -2 1993 10 18 18 24 32 39 49 52 38 17 08 08 1994 07 04 12 26 35 46 50 57 39 26 08 11 1995 12 21 18 24 34 38 45 55 36 24 13 09 1996 06 12 16 20 39 41 54 52 29 16 19 03 1997 -1 13 13 19 26 46 51 53 43 19 17 08 1998 12 15 13 25 31 40 59 52 46 27 16 03 1999 11 07 21 20 30 32 50 49 28 19 09 03 2000 01 14 17 28 29 44 52 52 33 32 10 11 2001 10 08 21 24 34 36 57 52 36 28 13 08 2002 03 06 03 27 35 48 56 50 39 30 19 08 2003 17 08 22 24 29 46 53 57 41 28 12 07 2004 08 06 21 32 32 44 52 51 35 26 08 04 2005 19 18 20 20 34 37 56 53 42 30 16 -2 2006 10 11 17 27 35 48 56 49 31 24 04 05 2007 04 03 09 24 32 38 56 56 33 19 14 02 2008 -7 04 17 21 27 40 54 53 41 22 13 07 2009 15 12 21 19 43 44 56 48 31 22 12 01 2010 05 12 18 21 26 44 49 53 44 24 06 03 2011 -5 -6 19 21 26 46 51 57 44 27 19 04 2012 07 16 13 25 37 45 57 55 45 24 16 05 2013 -6 11 13 21 28 40 57 52 33 27 15 03 2014 08 14 18 25 27 46 58 48 41 35 12 03 2015 09 15 16 24 32 49 54 56 48 31 15 06 2016 08 08 20 25 35 50 54 49 37 31 12 11 2017 05 15 17 23 32 44 57 52 30 27 15 08 2018 13 11 12 22 36 47 57 53 41 25 12 05 2019 -7 10 24 27 32 38 48 49 42 05 10 07 2020 06 00 21 21 33 40 43 52 32 17 14 05 2021 06 13 11 18 32 49 56 51 37 26 16 10 2022 06 03 15 20 29 38 58 53 44 22 09 01 2023 10 -4 18 14 35 43 50 54 43 16 13 9 2024 1 13 20 20 29 50 49 51 43 25 12 13 Mean 4 9 16 23 32 42 53 52 38 25 13 5 Minimum -18 -14 03 14 23 32 43 41 28 05 01 -16 Year(s)
Recorded1971 1989 2002 2023 1975 1999 1969
20201980 1971
19992019 1976 1990
Table 10. Number of Days 32.0⁰F or Below and 0⁰F in Critical Months at the NMSU Agricultural Science Center at Farmington, NM, 1969-2024 No. of Days 32°F or Below No. of Days 0°F
or BelowYear Jan Feb Mar Apr May Jun Sep Oct Nov Dec Total Jan Feb Dec Total 1969 22 26 25 7 0 0 0 7 22 29 138 0 0 0 0 1970 29 25 26 23 2 0 0 12 23 30 170 1 0 0 1 1971 29 27 22 13 1 0 2 8 26 27 155 4 0 0 4 1972 31 27 19 10 2 0 0 2 24 31 146 0 0 0 0 1973 31 26 25 17 1 0 0 5 16 28 149 0 0 0 0 1974 30 28 14 14 2 0 0 2 24 30 144 2 0 0 0 1975 29 27 24 15 3 0 0 6 25 30 159 2 0 0 2 1976 31 22 24 8 0 0 0 10 22 31 148 2 0 0 2 1977 31 28 26 8 0 0 0 1 20 30 144 3 0 0 3 1978 28 21 12 6 2 0 0 1 14 29 111 0 1 5 6 1979 29 27 25 11 3 0 0 5 24 31 155 3 1 0 4 1980 23 21 25 15 2 0 0 12 18 28 144 0 0 0 0 1981 29 26 24 3 1 0 0 11 19 31 144 0 0 0 0 1982 29 25 18 12 1 0 0 12 22 29 148 1 2 0 3 1983 31 25 18 15 6 0 1 0 18 26 140 0 0 0 0 1984 31 29 24 15 1 0 0 12 18 29 159 0 0 0 0 1985 31 25 16 5 1 0 1 2 19 30 130 0 1 0 1 1986 28 21 20 6 0 0 0 6 18 29 128 0 0 0 0 1987 28 25 24 10 0 0 0 3 22 31 143 0 0 0 0 1988 31 25 27 9 2 0 0 0 16 29 139 2 0 0 2 1989 31 24 13 5 0 0 0 6 27 31 137 0 2 0 2 1990 30 21 14 3 0 0 0 6 19 28 121 2 0 7 9 1991 31 22 20 11 2 0 0 4 23 31 144 2 0 0 2 1992 31 23 15 3 0 0 0 2 28 29 131 0 0 1 1 1993 28 22 24 11 3 0 0 9 25 31 153 0 0 0 0 1994 30 24 14 8 0 0 0 4 22 28 130 0 0 0 0 1995 28 18 15 15 0 0 0 7 23 28 134 0 0 0 0 1996 31 23 21 11 0 0 2 9 24 28 149 0 0 0 0 1997 29 27 23 16 1 0 0 11 22 31 160 1 0 0 1 1998 31 23 20 17 1 0 0 4 22 30 148 0 0 0 0 1999 30 26 19 12 4 1 2 8 24 30 156 0 0 0 0 2000 25 24 5 1 0 0 1 24 29 132 0 0 0 0 2001 31 23 13 6 0 0 0 2 13 29 117 0 0 0 0 2002 31 28 23 2 0 0 0 4 25 31 144 0 0 0 0 2003 30 22 21 9 3 0 0 2 18 29 134 0 0 0 0 2004 31 25 11 1 1 0 0 6 20 30 125 0 0 0 0 2005 27 17 21 8 0 0 0 1 19 30 123 0 0 1 1 2006 29 27 20 3 0 0 1 10 17 30 137 0 0 0 0 2007 31 22 14 4 1 0 0 5 23 28 128 0 0 0 0 2008 29 29 23 12 2 0 0 6 20 28 149 3 0 0 3 2009 30 25 20 14 0 0 1 10 17 31 148 0 0 0 0 2010 31 28 25 9 5 0 0 5 24 20 147 0 0 0 0 2011 31 25 18 9 3 0 0 6 23 31 146 2 3 0 5 2012 31 29 20 6 0 0 0 5 17 28 136 0 0 0 0 2013 27 28 18 9 2 0 0 11 22 31 148 2 0 0 2 2014 30 26 20 12 2 0 0 0 22 26 138 0 0 0 0 2015 30 25 13 8 1 0 0 2 21 31 131 0 0 0 0 2016 30 26 21 6 0 0 0 1 10 28 122 0 0 0 0 2017 28 16 8 10 1 0 2 3 9 28 105 0 0 0 0 2018 30 23 20 6 0 0 0 4 4 31 118 0 0 0 0 2019 31 26 8 4 1 0 0 17 4 30 121 2 0 0 2 2020 31 27 17 6 0 0 2 6 17 31 137 0 0 0 0 2021 31 27 25 9 2 0 0 9 18 27 148 0 0 0 0 2022 31 26 22 9 2 0 0 7 25 27 149 0 0 0 0 2023 29 25 26 13 0 0 0 7 18 26 144 0 1 0 1 2024 28 22 22 9 1 0 0 2 23 31 138 0 0 0 0 Mean 30 25 20 9 1 0 0 6 20 29 140 1 0 0 1 Total 1654 1379 1109 523 69 1 14 319 1122 1634 7824 34 11 14 59
Table 11. Number of Days 95.0⁰F or Above and Number of Days 100.0⁰F or Above in Critical Months at the NMSU Agricultural Science Center at Farmington, NM, 1969-2024 Number of Days 95⁰ F or above Number of Days 100⁰ F
or aboveYear May Jun Jul Aug Sep Total Jun Jul Total 1969 0 1 3 5 1 10 0 0 0 1970 0 5 13 5 0 23 0 0 0 1971 0 5 11 0 0 16 0 2 2 1972 0 0 13 4 0 17 0 1 1 1973 0 5 6 6 0 17 0 0 0 1974 0 17 1 0 0 18 0 0 0 1975 0 1 1 3 0 5 0 0 0 1976 0 3 11 0 0 14 0 1 1 1977 0 3 6 3 0 12 0 0 0 1978 0 1 2 0 0 3 0 0 0 1979 0 1 9 3 0 13 0 0 0 1980 0 6 11 5 0 22 0 0 0 1981 0 5 5 1 0 11 0 0 0 1982 0 0 4 1 0 5 0 0 0 1983 0 0 3 1 0 4 0 0 0 1984 0 0 3 0 0 3 0 0 0 1985 0 3 12 1 0 16 0 0 0 1986 0 0 2 2 0 4 0 0 0 1987 0 0 2 0 0 2 0 0 0 1988 0 5 7 0 0 12 0 0 0 1989 0 2 16 0 0 18 0 5 5 1990 0 8 3 0 0 11 2 1 3 1991 0 0 3 0 0 3 0 0 0 1992 0 0 2 1 0 3 0 0 0 1993 0 4 3 2 0 9 0 0 0 1994 0 6 11 5 0 22 1 0 1 1995 0 0 12 6 1 19 0 3 3 1996 0 0 6 4 0 10 0 0 0 1997 0 0 4 0 0 4 0 0 0 1998 0 3 16 1 0 20 0 2 2 1999 0 0 2 0 0 2 0 0 0 2000 1 0 5 7 0 13 0 0 0 2001 0 3 10 0 0 13 0 0 0 2002 1 14 16 5 0 36 0 1 1 2003 1 2 26 7 0 36 0 9 9 2004 0 3 6 2 0 11 0 0 0 2005 0 2 22 1 0 25 0 7 7 2006 0 11 11 0 0 22 0 1 1 2007 0 3 12 3 0 18 0 0 0 2008 0 0 0 3 0 3 0 0 0 2009 0 0 7 1 0 8 0 0 0 2010 0 1 6 0 0 7 0 0 0 2011 0 3 4 2 0 9 0 0 0 2012 0 5 2 1 0 8 0 0 0 2013 0 5 1 0 0 6 0 0 0 2014 0 0 8 0 0 8 0 0 0 2015 0 7 2 0 0 9 0 0 0 2016 0 11 6 0 0 17 1 0 1 2017 0 5 6 0 0 11 1 0 1 2018 0 6 11 5 0 22 0 0 0 2019 0 0 1 1 0 2 0 0 0 2020 0 0 0 4 4 8 0 0 0 2021 0 8 9 0 0 17 1 2 3 2022 0 1 4 0 3 8 0 0 0 2023 0 0 8 0 0 8 0 0 0 2024 0 1 3 2 0 6 0 0 0 Mean 0 3 7 2 0 12 0 1 1 Total 3 175 389 103 9 679 6 35 41 Evaporation
Table 12. Average Daily Evaporation in Inches at the NMSU Agricultural Science Center at Farmington, NM, 1975-2024 Year Apr May Jun Jul Aug Sep Oct Mean 1975 0.206 0.299 0.401 0.396 0.403 0.270 0.242 0.317 1976 0.309 0.380 0.515 0.444 0.423 0.302 0.190 0.366 1977 0.304 0.396 0.498 0.423 0.394 0.317 0.213 0.364 1978 0.310 0.311 0.427 0.469 0.422 0.321 0.257 0.360 1979 0.278 0.278 0.362 0.354 0.342 0.317 0.229 0.309 1980 0.258 0.322 0.489 0.452 0.406 0.272 0.280 0.354 1981 0.254 0.297 0.470 0.388 0.363 0.255 0.165 0.313 1982 0.245 0.323 0.427 0.392 0.314 0.193 0.260 0.308 1983 0.328 0.384 0.404 0.357 0.291 0.203 0.328 1984 0.245 0.391 0.389 0.379 0.334 0.261 0.106 0.301 1985 0.212 0.282 0.409 0.409 0.374 0.233 0.141 0.294 1986 0.245 0.317 0.366 0.366 0.366 0.225 0.314 1987 0.277 0.383 0.393 0.335 0.274 0.101 0.294 1988 0.373 0.369 0.421 0.314 0.285 0.198 0.327 1989 0.393 0.418 0.446 0.356 0.312 0.385 1990 0.255 0.373 0.516 0.411 0.366 0.294 0.186 0.343 1991 0.299 0.377 0.366 0.411 0.358 0.284 0.349 1992 0.277 0.280 0.405 0.383 0.348 0.272 0.211 0.311 1993 0.322 0.339 0.465 0.477 0.328 0.304 0.180 0.345 1994 0.278 0.383 0.501 0.504 0.402 0.309 0.246 0.375 1995 0.249 0.315 0.424 0.445 0.375 0.324 0.241 0.339 1996 0.303 0.435 0.424 0.451 0.358 0.236 0.182 0.341 1998 0.242 0.367 0.471 0.420 0.366 0.334 0.189 0.341 1999 0.277 0.347 0.437 0.379 0.280 0.274 0.240 0.319 2000 0.320 0.426 0.470 0.425 0.366 0.295 0.157 0.351 2001 0.281 0.378 0.465 0.405 0.352 0.361 0.235 0.354 2002 0.307 0.428 0.493 0.455 0.396 0.261 0.149 0.356 2003 0.274 0.374 0.493 0.504 0.397 0.311 0.212 0.366 2004 0.248 0.403 0.480 0.442 0.365 0.276 0.159 0.339 2005 0.272 0.362 0.420 0.490 0.338 0.277 0.162 0.332 2006 0.323 0.415 0.488 0.408 0.341 0.251 0.163 0.341 2007 0.266 0.315 0.447 0.416 0.360 0.289 0.211 0.329 2008 0.311 0.367 0.460 0.381 0.367 0.296 0.208 0.341 2009 0.277 0.285 0.336 0.430 0.362 0.261 0.169 0.303 2010 0.278 0.351 0.413 0.395 0.306 0.286 0.182 0.316 2011 0.300 0.344 0.482 0.424 0.377 0.252 0.171 0.336 2012 0.293 0.396 0.482 0.381 0.366 0.296 0.241 0.351 2013 0.300 0.349 0.462 0.387 0.318 0.265 0.177 0.323 2014 0.252 0.335 0.455 0.421 0.296 0.218 0.185 0.309 2015 0.247 0.210 0.295 0.302 0.343 0.255 0.141 0.256 2016 0.234 0.291 0.499 0.408 0.234 0.223 0.184 0.296 2017 0.187 0.286 0.469 0.333 0.297 0.207 0.225 0.286 2018 0.346 0.382 0.421 0.397 0.374 0.298 0.126 0.335 2019 0.244 0.184 0.382 0.401 0.367 0.277 0.214 0.296 2020 0.306 0.396 0.448 0.361 0.409 0.308 0.234 0.352 2021 0.348 0.378 0.412 0.401 0.332 0.251 0.157 0.325 2022 0.304 0.431 0.371 0.355 0.327 0.237 0.120 0.306 2023 0.292 0.312 0.392 0.452 0.353 0.262 0.216 0.325 2024 0.279 0.376 0.368 0.407 0.297 0.333 0.186 0.321 Mean 0.276 0.345 0.432 0.412 0.353 0.277 0.192 0.329 Years 46 50 50 50 50 50 47 50 Blank cells represent three or more days of missing data.
Table 13. Total Monthly Evaporation in Inches at the NMSU Agricultural Science Center at Farmington, NM, 1975-2024 Year Apr May Jun Jul Aug Sep Oct Total 1975 6.18 9.27 12.03 12.28 12.49 8.10 7.50 67.85 1976 9.27 11.78 15.45 13.76 13.11 9.06 5.89 78.32 1977 9.12 12.28 14.94 13.11 12.21 9.51 6.60 77.77 1978 9.30 9.64 12.81 14.54 13.08 9.63 7.97 76.97 1979 8.34 8.62 10.86 10.97 10.60 9.51 7.10 66.00 1980 7.74 9.98 14.67 14.01 12.59 8.16 8.68 75.83 1981 7.62 9.21 14.10 12.03 11.25 7.65 5.12 66.98 1982 7.35 10.01 12.81 12.14 9.73 7.28 8.06 67.38 1983 8.85 11.51 12.51 11.06 8.72 6.35 59.00 1984 6.37 12.15 11.66 11.74 10.43 7.84 3.29 63.48 1985 6.35 8.74 12.27 12.68 11.61 6.99 4.44 63.08 1986 7.36 9.82 10.97 11.34 11.34 6.75 57.58 1987 6.64 11.47 12.19 10.39 8.23 3.12 52.04 1988 11.55 11.06 13.05 9.74 8.55 6.16 60.11 1989 12.18 12.54 13.83 11.04 9.37 58.96 1990 7.65 11.56 15.48 12.74 11.35 8.82 5.77 73.37 1991 8.68 11.68 10.99 12.77 11.11 8.53 63.76 1992 7.76 8.67 12.15 11.89 10.80 8.19 6.53 65.99 1993 9.66 10.52 13.94 14.78 10.17 9.11 5.57 73.75 1994 8.35 11.90 15.04 15.63 12.46 9.28 7.38 80.04 1995 7.48 9.78 12.72 13.81 11.63 9.74 7.48 72.64 1996 9.10 13.50 12.72 13.99 11.10 7.08 5.66 73.15 1997 7.37 9.33 11.84 12.36 9.59 7.78 5.80 64.07 1998 7.27 11.37 14.12 13.03 11.36 10.03 5.85 73.03 1999 8.31 10.75 13.12 11.75 8.68 8.21 7.45 68.27 2000 9.62 13.20 14.11 13.16 11.36 8.86 4.87 75.18 2001 8.45 11.35 13.92 11.75 10.93 10.59 7.29 74.28 2002 9.21 13.29 14.79 14.09 12.28 7.82 4.63 76.11 2003 8.22 11.58 14.80 15.63 12.32 9.33 6.58 78.46 2004 7.43 12.49 14.27 13.69 11.32 8.28 4.93 72.41 2005 8.17 11.21 12.59 15.20 10.47 8.30 5.03 70.97 2006 8.72 12.85 14.65 12.65 10.58 7.52 5.05 72.02 2007 7.97 9.78 13.41 12.90 11.15 8.68 6.54 70.43 2008 9.33 11.38 13.80 11.84 11.39 8.89 6.45 73.08 2009 8.33 8.86 10.08 13.34 11.24 7.83 5.26 64.94 2010 8.35 10.88 12.40 12.25 9.49 8.58 5.64 67.59 2011 9.02 10.68 14.46 13.15 11.71 7.57 5.32 71.91 2012 8.78 12.29 14.45 11.80 11.35 8.88 7.48 75.03 2013 9.02 10.82 13.86 12.00 9.86 7.96 5.50 69.02 2014 7.68 10.64 13.64 13.52 10.24 8.09 5.69 69.50 2015 8.02 7.87 10.64 10.08 11.49 8.17 5.38 61.65 2016 7.83 9.94 14.98 13.12 8.40 7.74 5.80 67.81 2017 7.24 10.00 14.10 12.83 9.30 7.78 7.05 68.29 2018 10.57 12.18 13.42 12.91 11.79 9.08 4.72 74.67 2019 7.63 7.63 11.74 12.75 11.45 8.83 6.80 66.83 2020 9.19 12.32 13.13 12.44 12.71 9.69 7.55 77.02 2021 10.51 11.78 12.64 12.77 10.98 8.31 5.71 72.69 2022 9.27 13.36 12.22 12.82 11.22 8.45 5.19 72.54 2023 8.80 10.05 12.14 14.05 11.42 8.25 6.71 71.42 2024 8.64 11.65 12.46 13.49 11.13 10.30 7.16 74.83 Mean 8.32 10.76 13.08 12.94 11.09 8.52 6.09 69.76 Years 46 50 50 50 50 50 47 50 Blank cells represent three or more days of missing data. Wind Run
Table 14. Wind Run Monthly Average in Miles Per Day (MPD) at 6-in. and 10-in. Anemometer Heights* Above the Evaporation Pan Rim at the NMSU Agricultural Science Center at Farmington, NM, 1980-2024 Year Jan Feb Mar Apr May Jun Jul Aug Sep Oct Nov Dec 1980 64 66 100 97 80 57 44 41 27 30 23 14 1981 50 80 94 85 71 64 58 60 20 55 56 52 1982 69 36 63 89 78 42 59 75 77 86 77 89 1983 82 101 107 101 108 98 76 70 62 73 94 98 1984 63 101 104 114 78 94 66 61 70 71 99 67 1985 49 87 128 98 76 66 70 76 70 72 148 55 1986 53 61 72 95 78 64 52 66 60 45 50 45 1987 60 41 50 50 31 22 25 19 21 48 71 79 1988 76 73 99 88 99 81 75 71 75 64 82 82 1989 84 75 96 86 69 73 78 72 73 68 68 59 1990 78 97 90 91 91 84 82 82 76 72 71 83 1991 61 73 106 98 99 75 79 67 72 57 59 47 1992 64 66 80 76 72 74 66 70 62 58 68 66 1993 103 86 105 107 91 81 71 75 74 65 82 79 1994 81 96 83 94 71 61 72 72 63 58 84 59 1995 76 65 83 81 80 61 63 59 52 64 58 49 1996 92 79 88 93 72 73 72 60 44 51 53 71 1997 43 79 78 73 70 62 55 48 50 48 39 35 1998 59 75 83 81 66 72 70 66 62 78 66 59 1999 76 74 83 109 95 70 63 63 61 65 73 78 2000 83 88 93 93 85 80 66 64 62 63 60 57 2001 65 74 72 91 83 77 64 67 74 74 65 75 2002 74 90 104 83 59 64 69 55 62 50 56 49 2003 36 58 60 68 70 70 56 60 56 50 56 62 2004 36 56 61 65 53 54 54 46 48 44 52 29 2005 52 54 72 71 50 50 49 43 44 44 46 39 2006 52 51 61 66 57 61 53 47 43 44 37 48 2007 40 53 47 62 50 41 51 62 38 54 2008 48 69 81 92 82 65 50 35 31 60 65 69 2009 41 57 77 80 52 44 48 43 47 54 49 66 2010 33 59 79 82 2011 74 60 57 58 61 72 51 2012 65 78 84 84 73 62 50 52 46 63 60 64 2013 58 82 94 103 77 65 62 49 54 65 61 64 2014 76 69 90 2015 47 51 46 38 42 39 29 35 43 44 2016 26 47 61 44 41 36 36 29 25 22 28 21 2017 26 25 36 32 25 24 16 22 37 25 28 2018 32 33 42 66 35 38 28 24 16 30 17 13 2019 20 67 57 54 46 46 50 67 49 38 2020 50 65 56 74 65 72 54 52 50 47 51 42 2021 51 55 62 73 63 57 58 42 31 50 36 40 2022 37 45 76 75 70 60 46 43 33 35 55 43 2023 51 55 60 72 44 48 41 51 40 42 33 41 2024 39 54 53 69 75 54 49 45 49 36 37 32 Mean
(MPD)58 67 79 81 69 62 57 54 51 55 58 54 Mean
(MPH)**2.4 2.8 3.3 3.4 2.9 2.6 2.4 2.2 2.1 2.3 2.4 2.3 Blank cells represent three or more days of missing data. *Low wind anenometer height at 6 in. above the evaporation pan (1980-March 2019) was changed due to installation of a new anemometer to a 10 in. height beginning April 2019. **Mean miles per hour (MPH) = mean miles per day (MPD)/24 hours
Table 15. Wind Run Miles Per Day (MPD) Measured at 79-in. Anemometer Height Above the Evaporation Pan Rim at the NMSU Agricultural Science Center at Farmington, NM, 1981-2024 Year Jan Feb Mar Apr May Jun Jul Aug Sep Oct Nov Dec 1981 112 124 141 124 102 81 62 82 71 81 76 58 1982 88 63 97 127 100 122 103 91 99 95 86 99 1983 111 139 147 154 141 120 116 102 113 107 130 136 1984 64 115 93 136 88 96 52 46 49 44 136 110 1985 95 127 183 155 142 136 136 133 125 127 72 117 1986 113 129 145 179 154 139 128 134 128 118 116 99 1987 139 131 143 158 139 126 122 119 132 108 123 117 1988 121 122 163 148 166 138 132 126 120 91 98 98 1989 97 133 151 147 132 123 126 120 125 115 112 104 1990 125 152 146 170 165 154 141 136 127 135 127 130 1991 101 120 190 191 167 138 140 119 129 111 109 85 1992 117 119 137 142 133 137 118 118 111 110 113 106 1993 164 139 153 171 144 86 57 80 103 87 92 1994 130 156 144 166 135 130 136 127 120 119 154 115 1995 137 129 147 176 185 137 128 118 115 137 129 100 1996 171 145 161 182 149 140 127 119 112 134 119 147 1997 106 149 146 153 137 113 112 101 105 115 118 110 1998 100 133 145 144 112 120 111 100 105 131 111 106 1999 143 142 145 186 196 92 85 100 107 98 93 126 2000 132 141 149 158 144 135 108 104 108 110 113 109 2001 116 127 173 147 141 128 106 108 121 125 110 132 2002 117 144 163 134 126 115 114 96 108 90 110 107 2003 98 134 143 139 134 128 106 107 113 103 116 129 2004 93 121 135 134 120 114 112 99 100 102 119 87 2005 107 111 146 153 117 116 111 94 98 98 119 113 2006 131 140 139 143 126 127 106 95 103 104 122 106 2007 96 131 121 147 122 129 109 89 96 117 103 128 2008 106 125 142 165 144 128 101 95 94 108 121 133 2009 100 119 144 157 108 96 96 88 94 106 87 145 2010 73 100 130 154 125 63 94 78 79 89 108 90 2011 78 113 130 159 127 107 82 78 79 85 102 74 2012 99 110 114 116 99 89 72 76 73 90 79 94 2013 83 106 122 137 98 73 81 71 76 88 84 82 2014 97 82 99 118 78 74 80 61 52 58 74 65 2015 57 67 76 90 68 56 61 57 38 49 66 56 2016 41 73 104 89 71 71 62 59 45 63 63 53 2017 58 59 89 84 81 77 65 58 61 63 40 38 2018 50 77 99 129 80 68 78 67 54 69 62 71 2019 68 77 85 102 69 74 46 46 50 67 66 42 2020 57 81 68 96 81 86 63 54 58 48 62 61 2021 72 71 79 101 82 72 70 59 39 68 46 45 2022 47 66 105 105 101 82 60 56 45 53 68 55 2023 69 72 77 97 60 65 56 68 46 54 41 53 2024 52 72 70 90 101 72 63 58 55 47 46 37 Mean
(MPD)98 113 129 140 120 106 96 91 90 94 96 95 Mean
(MPH)*4.1 4.7 5.4 5.8 5.0 4.4 4.0 3.8 3.8 3.9 4.0 3.9 Blank cells represent three or more days of missing data. *Mean miles per hour (MPH) = mean miles per day (MPD)/24 hours Solar Radiation
Table 16. Average Solar Radiation in Langleys (Ly per day) at the NMSU Agricultural Science Center at Farmington, NM, 1977-2024 Year Jan Feb Mar Apr May Jun Jul Aug Sep Oct Nov Dec Total Mean 1977 204 305 386 552 438 530 501 464 396 360 4136 414 1978 157 168 334 459 490 586 641 491 401 292 185 166 4370 364 1979 166 261 302 423 445 527 489 477 459 267 165 155 4136 345 1980 141 192 300 429 459 529 595 501 436 342 280 145 4349 362 1981 190 296 292 473 499 607 550 489 422 314 248 200 4580 382 1982 129 207 369 536 594 707 651 565 470 393 227 208 5056 421 1983 188 294 345 518 654 734 793 725 583 332 230 176 5572 464 1984 250 345 486 540 688 494 736 744 595 317 226 188 5609 467 1985 242 499 618 816 843 801 557 410 256 184 5226 523 1986 243 304 505 584 837 736 1028 1223 918 513 282 205 7378 615 1987 229 289 506 566 551 665 638 542 483 352 246 197 5264 439 1988 220 305 474 496 626 623 621 555 486 470 251 216 5343 445 1989 224 280 419 550 628 633 619 570 498 361 277 219 5278 440 1990 222 282 316 479 593 662 620 541 462 361 234 203 4975 415 1991 212 309 356 554 651 556 613 537 450 340 249 146 4973 414 1992 189 268 358 509 530 616 560 501 451 324 238 167 4711 393 1993 160 230 374 514 532 599 614 464 456 331 240 187 4701 392 1994 223 262 371 439 482 564 555 496 411 300 225 178 4506 376 1995 189 288 358 438 481 552 520 459 373 324 212 157 4351 363 1996 240 309 463 580 651 609 676 604 458 357 250 226 5423 452 1997 215 314 516 513 613 657 640 567 491 390 267 220 5403 450 1998 236 260 443 563 661 725 604 565 506 331 266 244 5404 450 1999 263 363 458 527 624 702 584 515 505 438 320 241 5540 462 2000 251 305 399 581 689 696 673 579 479 325 255 213 5445 454 2001 241 322 424 508 672 766 633 580 541 396 286 248 5617 468 2002 251 383 492 593 710 742 663 601 479 372 294 219 5799 483 2003 249 315 452 596 640 719 692 604 510 401 200 203 5581 465 2004 186 264 418 451 656 703 646 531 468 346 214 201 5084 424 2005 206 272 402 526 624 639 664 539 442 347 277 232 5170 431 2006 258 362 375 539 644 616 533 472 426 308 249 188 4970 414 2007 228 284 396 539 562 676 535 455 407 406 310 220 5018 418 2008 287 341 514 617 673 729 641 587 504 405 286 223 5807 484 2009 262 352 431 541 608 589 637 581 473 358 276 200 5308 442 2010 232 293 451 553 677 695 624 547 501 375 286 175 5409 451 2011 264 354 465 562 668 712 652 570 465 374 260 202 5548 462 2012 260 333 458 544 656 706 601 551 491 415 303 244 5562 464 2013 269 360 468 571 636 688 599 547 464 425 260 221 5508 459 2014 265 313 523 614 698 539 474 376 204 4006 445 2015 218 326 474 572 517 602 575 556 481 362 289 206 5178 432 2016 240 354 458 524 618 694 658 551 489 408 258 216 5469 456 2017 194 292 442 532 608 721 639 557 479 412 271 254 5401 450 2018 277 322 438 556 650 698 644 560 504 314 300 210 5473 456 2019 245 295 410 515 551 650 639 580 486 423 280 208 5281 440 2020 238 343 394 581 668 666 594 575 480 400 272 224 5436 453 2021 246 344 416 559 608 630 582 518 448 362 281 197 5190 432 2022 272 261 414 543 610 603 570 520 440 347 271 194 5046 420 2023 205 196 322 524 566 629 621 509 433 370 251 195 4822 402 2024 208 200 384 526 588 569 588 477 455 339 239 220 4792 399 Mean 225 296 414 530 605 651 630 564 481 366 257 203 5222 435 Blank cells represent 3 or more days of missing data. 2010 - 2016 NMSU data (not including missing values) on the aWhere Inc. weather database (http://awhere.com) as y = 3.025 + 0.816x (n=2018, R2 = 0.695) where y = NMSU values and x = aWhere values. (2015 May and June), (2016 August, September, October) Corn Growing Degree Days (GDD)
Table 17. Total Monthly Corn Growing Degree Days* (GDD) at the NMSU Agricultural Science Center at Farmington, NM, 1969-2024 Year May Jun Jul Aug Sep Total May-Sep Total to 1st Frost (32 ºF) Date of 1st Frost 1969 434 510 729 744 570 2987 3017 5-Oct 1970 434 555 744 744 420 2897 2949 8-Oct 1971 372 600 729 713 450 2864 2684 18-Sep 1972 434 615 744 713 495 3001 3201 30-Oct 1973 372 640 713 713 435 2873 2990 11-Oct 1974 465 645 729 698 450 2987 3227 30-Oct 1975 326 525 713 667 435 2666 2806 14-Oct 1976 403 585 744 698 495 2925 2978 7-Oct 1977 372 675 744 729 540 3060 3386 31-Oct 1978 310 570 729 667 450 2726 2576 20-Sep 1979 341 510 682 667 555 2755 2986 22-Oct 1980 341 570 698 682 450 2741 2869 16-Oct 1981 372 600 682 651 450 2755 2875 16-Oct 1982 341 525 682 698 450 2696 2741 6-Oct 1983 341 495 682 729 525 2772 2615 21-Sep 1984 465 555 729 713 480 2942 3017 15-Oct 1985 397 600 710 692 416 2815 2926 30-Sep 1986 377 574 661 693 395 2700 2790 12-Oct 1987 366 592 674 646 473 2751 2873 19-Oct 1988 396 607 722 697 476 2898 2981 12-Nov 1989 468 565 731 670 540 2974 3131 18-Oct 1990 378 635 729 673 532 2947 3029 9-Oct 1991 409 557 704 701 471 2842 3153 28-Oct 1992 385 536 630 639 484 2674 2763 8-Oct 1993 416 538 652 615 454 2675 2854 19-Oct 1994 426 628 729 746 495 3024 3169 17-Oct 1995 330 516 676 729 494 2745 2782 6-Oct 1996 477 612 730 695 410 2924 2785 19-Sep 1997 441 563 685 670 568 2927 3081 13-Oct 1998 417 499 746 716 560 2938 2984 6-Oct 1999 364 554 710 655 451 2734 2702 28-Sep 2000 479 640 665 663 536 2983 3117 14-Oct 2001 465 591 751 691 578 3076 3214 11-Oct 2002 446 625 739 674 486 2973 3004 4-Oct 2003 453 586 763 730 485 3017 3329 27-Oct 2004 456 588 688 667 452 2851 3057 23-Oct 2005 428 555 745 683 542 2953 3228 31-Oct 2006 477 631 743 674 395 2920 2826 23-Sep 2007 388 581 711 720 509 2909 2981 7-Oct 2008 370 570 720 691 501 2852 2980 12-Oct 2009 450 515 738 660 515 2878 2753 22-Sep 2010 373 584 728 662 519 2866 3139 26-Oct 2011 352 584 729 722 476 2863 2929 8-Oct 2012 459 650 729 722 514 3074 3343 25-Oct 2013 396 627 758 690 528 2999 3051 5-Oct 2014 390 596 757 658 565 2966 3288 3-Nov 2015 316 597 695 699 549 2856 3176 28-Oct 2016 343 689 710 648 488 2878 3092 20-Oct 2017 363 627 760 695 522 2967 2919 25-Sep 2018 475 641 801 738 573 3229 3357 15-Oct 2019 276 529 691 704 534 2733 2862 11-Oct 2020 477 580 692 714 489 2951 2929 29-Sep 2021 433 630 754 664 483 2964 3084 13-Oct 2022 436 608 753 718 575 3090 3326 24-Oct 2023 415 503 725 697 500 2840 2977 13-Oct 2024 382 655 722 689 549 2997 3176 11-Oct Mean 401 585 718 692 494 2891 3001 Mean
Accum-
mulation401 986 1704 2396 2891 *Temperature parameters used for calculating corn (GDD) units are 86°F and 50°F. Soil Temperature
Table 18. Average Monthly Soil Temperature in ⁰F at 4 in. Below the Bare Soil Surface at the NMSU Agricultural Science Center at Farmington, NM, 2001-2024 Month Maximum
AverageMinimum
AverageAverage* Extreme
Maximum
AverageExtreme
Minimum
AverageJan 33 29 31 40 23 Feb 40 33 36 49 28 Mar 53 40 47 64 33 Apr 65 49 57 76 40 May 76 60 68 85 50 Jun 87 71 79 94 64 Jul 94 77 85 99 69 Aug 91 75 83 97 68 Sep 82 67 74 92 56 Oct 65 52 59 78 41 Nov 48 39 44 60 30 Dec 35 30 33 44 24 Mean 64 52 58 73 44 *[(maximum + minimum)/2]
Table 19. Average Maximum Soil Temperature in ⁰F at 4 in. Below the Bare Soil Surface at the NMSU Agricultural Science Center at Farmington, NM, 2001-2024 Year Jan Feb Mar Apr May Jun Jul Aug Sep Oct Nov Dec 2001 30 37 51 65 78 88 93 90 84 67 52 34 2002 32 38 52 70 79 91 96 91 80 63 46 35 2003 38 41 52 66 76 87 96 95 81 69 46 36 2004 31 36 60 66 81 86 92 93 81 64 47 32 2005 39 44 55 69 82 89 101 93 82 63 48 36 2006 37 44 54 72 83 94 96 92 79 62 51 33 2007 30 40 57 68 80 92 101 99 88 67 47 33 2008 30 35 53 64 75 88 97 93 84 66 49 35 2009 32 40 54 63 79 84 98 93 85 62 46 29 2010 28 38 50 63 73 85 92 86 77 66 46 40 2011 30 36 53 62 69 84 90 90 77 61 45 33 2012 32 32 53 67 78 88 92 90 82 65 49 36 2013 28 35 48 64 76 88 94 87 80 60 47 31 2014 31 42 53 62 73 84 90 87 81 65 48 39 2015 34 45 56 66 72 86 89 89 83 68 47 35 2016 31 40 55 65 76 89 93 89 80 69 51 35 2017 36 45 56 64 74 73 89 89 83 65 56 39 2018 38 46 55 68 80 91 96 93 86 65 48 38 2019 34 36 54 65 70 85 91 89 81 62 46 35 2020 32 40 54 67 77 85 90 91 81 66 50 33 2021 33 42 51 67 77 89 96 92 85 65 52 37 2022 35 39 51 66 76 88 95 93 86 66 43 36 2023 35 37 49 60 74 82 92 91 83 69 52 39 2024 35 47 56 56 76 90 94 93 85 70 47 40 Mean 33 40 53 65 76 87 94 91 82 65 48 35 *The average monthly maximum soil temperature represents the sum of the maximum daily temperatures in each month divided by the number of days in that month.
Table 20. Soil Extreme Maximum Temperature in ⁰F at 4 in. Below the Bare Soil Surface at the NMSU Agricultural Science Center at Farmington, NM, 2001-2024 Year Jan Feb Mar Apr May Jun Jul Aug Sep Oct Nov Dec 2001 32 47 63 78 86 93 100 96 90 83 62 47 2002 39 48 67 75 90 95 99 97 90 75 56 45 2003 45 49 63 74 90 91 100 99 95 79 59 45 2004 35 50 73 79 85 90 101 98 94 78 57 42 2005 45 50 64 79 93 99 106 103 89 76 59 46 2006 46 56 64 81 91 99 103 98 92 78 60 42 2007 34 52 68 82 88 102 105 102 100 79 63 45 2008 32 47 63 72 87 99 100 100 93 82 63 46 2009 44 53 65 74 86 94 101 99 94 76 58 40 2010 33 43 60 71 87 90 97 91 82 80 57 44 2011 38 45 64 71 78 87 98 97 86 75 55 42 2012 38 48 66 77 82 94 96 93 90 76 57 48 2013 40 40 62 74 82 95 97 95 94 70 55 40 2014 40 50 61 77 84 88 93 92 90 78 63 48 2015 44 52 70 75 82 96 97 95 89 82 60 42 2016 33 51 60 75 83 95 98 98 92 76 65 43 2017 44 53 67 75 84 94 98 96 93 75 79 52 2018 46 52 64 77 85 97 100 98 92 85 57 43 2019 40 49 68 78 81 93 95 97 91 75 53 43 2020 39 47 60 77 84 90 96 95 89 74 60 38 2021 40 48 61 75 84 96 100 99 94 77 61 47 2022 40 46 63 75 84 94 100 99 95 81 58 46 2023 41 44 65 79 81 87 97 95 91 79 61 46 2024 47 55 64 78 88 99 98 100 92 83 58 46 Mean 40 49 64 76 85 94 99 97 92 78 60 44 Maxi-
mum47 56 73 82 93 102 106 103 100 85 79 52 Year(s)
Recorded2006
2018 20242006 2004 2007 2005 2007 2005 2005 2007 2018 2017 2017
Table 21. Average Minimum Soil Temperature in ⁰F at 4 in. Below the Bare Soil Surface at the NMSU Agricultural Science Center at Farmington, NM, 2001-2024 Year Jan Feb Mar Apr May Jun Jul Aug Sep Oct Nov Dec 2001 29 33 41 49 60 70 76 73 69 55 43 29 2002 29 31 36 52 61 72 77 73 63 48 36 32 2003 32 34 39 49 60 70 78 76 63 54 38 31 2004 28 30 43 48 61 71 75 74 62 48 36 27 2005 34 35 38 47 58 68 75 71 67 50 39 26 2006 29 32 37 48 61 70 74 72 58 46 37 28 2007 26 33 40 47 58 70 78 76 65 50 41 29 2008 28 31 38 46 57 68 74 73 66 49 38 32 2009 31 34 41 46 61 69 81 75 71 52 38 26 2010 26 33 37 49 58 73 79 73 66 55 38 36 2011 29 29 43 52 59 73 81 82 69 52 38 30 2012 30 30 42 56 65 76 78 79 70 54 41 32 2013 21 33 40 50 62 74 80 74 66 49 39 28 2014 29 34 42 50 60 71 80 75 69 54 40 35 2015 30 36 45 51 56 68 73 74 67 56 37 32 2016 28 33 42 49 58 75 77 73 65 54 42 32 2017 34 37 44 48 56 73 78 74 67 49 42 32 2018 31 34 40 52 62 71 77 74 68 52 34 30 2019 31 33 42 51 54 67 77 77 69 52 39 32 2020 29 34 42 51 64 72 76 78 66 53 40 27 2021 28 34 39 50 62 74 78 73 67 49 41 32 2022 31 33 39 49 61 70 75 74 69 50 35 31 2023 32 33 40 47 61 68 78 76 68 57 43 33 2024 31 37 42 50 60 72 77 74 68 57 47 33 Mean 29 33 40 49 60 71 77 75 67 52 39 30 *The average monthly minimum soil temperature represents the sum of the minimum daily temperatures in each
-
-
month divided by the number of days in that month.
Table 22. Soil Extreme Minimum Temperature in ⁰F at 4 in. Below the Bare Soil Surface at the NMSU Agricultural Science Center at Farmington, NM, 2001-2024 Year Jan Feb Mar Apr May Jun Jul Aug Sep Oct Nov Dec 2001 24 25 35 41 46 62 69 66 63 46 27 24 2002 23 25 28 41 51 69 72 66 51 39 32 30 2003 27 30 33 40 50 65 73 70 54 45 26 24 2004 22 24 32 41 49 63 69 69 48 37 26 16 2005 31 31 35 35 44 60 69 64 56 44 27 12 2006 24 28 31 39 52 63 63 67 42 35 31 21 2007 19 28 30 36 44 61 71 64 50 40 30 19 2008 16 29 33 37 48 58 65 70 58 40 31 29 2009 29 29 31 35 51 64 73 71 62 35 32 16 2010 20 31 29 38 42 66 73 61 59 38 30 26 2011 25 18 34 35 47 68 77 78 61 41 34 26 2012 24 31 32 46 58 69 68 71 60 38 32 19 2013 9 31 31 32 55 65 70 60 50 37 29 20 2014 25 25 35 44 48 61 76 64 59 48 30 29 2015 23 30 34 44 50 58 67 69 60 46 33 26 2016 22 26 38 41 44 66 62 65 51 48 29 29 2017 29 30 31 36 45 64 70 69 51 44 34 29 2018 26 31 31 44 49 64 60 68 62 44 23 23 2019 23 29 36 43 45 58 70 72 58 34 32 27 2020 22 31 35 44 59 64 64 74 53 37 29 22 2021 23 31 32 40 57 66 66 68 61 42 30 26 2022 26 27 32 39 50 62 65 70 58 37 31 23 2023 28 28 32 39 50 64 72 68 62 46 29 27 2024 23 30 36 41 54 66 69 63 60 42 29 29 Mean 23 28 33 40 50 64 69 68 56 41 30 24 Mini-
mum9 18 28 32 42 58 60 60 42 34 23 12 Year(s)
Recorded2013 2011 2002 2013 2010 2008
2015
20192018 2013 2006 2019 2018 2005
- Margaret M. West, is a Research Scientist, Associate at NMSU’s Agricultural Science Center at Farmington (ASCF). Her research focuses on agronomy statewide variety trials, weather monitoring and dissemination of data for the New Mexico Climate Center and National Weather Service-ABQ sites located at ASCF.
-
Contents of publications may be freely reproduced, with an appropriate citation, for educational purposes. All other rights reserved. For permission to use publications for other purposes, contact farmingt@nmsu.edu or the authors listed on this webpage publication. New Mexico State University is an equal opportunity/affirmative action employer and educator. NMSU and the U.S. Department of Agriculture cooperating.
Weather Related Links
- Community Collaborative Rain, Hail & Snow Network (CoCoRaHS) - CoCoRaHS
- National Oceanic and Atmospheric Administration (NOAA) - Climate Data Online Search
- New Mexico Climate Center (NMCC) - ZiaMet Weather Station Network
- U.S. Department of Agriculture/Natural Resources Conservation Service (USDA-NRCS) - Air & Water Database Update Report
- Colorado Snowpack - San Miguel-Dolores-Animas-San Juan Basin